Treatment and management
Treatment for vision disorders involves a wide range of health services including primary care and specialist care.
Primary care
Primary care services, provided by general practitioners (GPs) and optometrists, involve the initial diagnosis and treatment of the condition, referrals, and the provision of continuing monitoring and care.
In 2015–16, eye disorders accounted for 1.9% of Australian GP consultations (Britt et al. 2016), while in 2019–20, there were 9.2 million Medicare Benefits Schedule (MBS) subsidised claims for optometrist consultations for 7.0 million individuals (DOH 2020a).
Specialist care
Ophthalmologists are medical doctors and surgeons who are specialised in the eye (RANZCO 2018a, 2019). In 2018–19, there were just over 1 million MBS-subsidised claims for surgical operations by an ophthalmologist (DHS 2019). Public patients treated in a public hospital are not included in this number. See Hospitalisations below.
Access to care
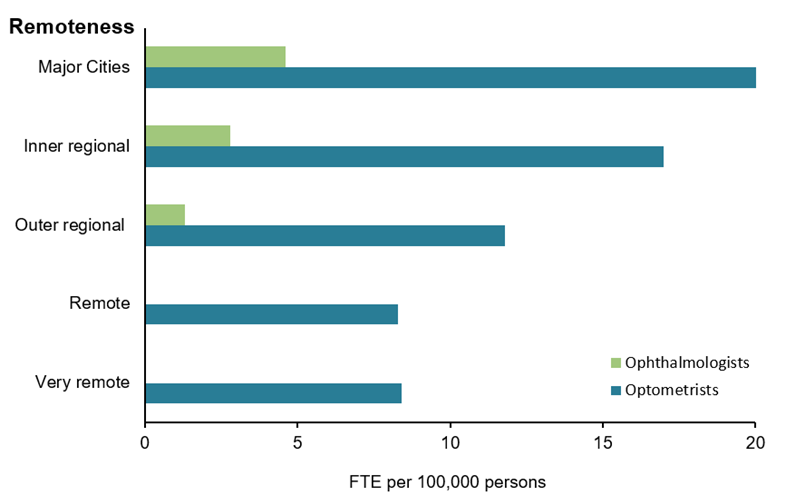
There were around 1,000 full-time equivalent (FTE) ophthalmologists and 4,800 FTE optometrists employed in Australia in 2019, or 4 FTE ophthalmologists and 19 FTE optometrists per 100,000 population. Major cities had the highest number and rate of employed eye-care providers, and workforce supply reduced with increasing remoteness (Figure 1).
Figure 1: Full-time equivalent (FTE) rate of eye-care providers, by remoteness area, 2019
Notes:
- There were insufficient numbers of ophthalmologists to calculate rates in Remote and Very remote areas.
- Data are based on optometrists and ophthalmologists employed in Australia and working in their registered profession.
- FTE per 100,000 population is based on a 38-hour work week for optometrists and 40-hour work week for ophthalmologists. Population by remoteness area is derived from the total Estimated Resident Population for 2019 from the ABS, catalogue number 3218.0 Regional Population Growth, Australia, Table 1 Estimated Residential Population, Remoteness Areas, Australia, released March 2020.
Source: AIHW analysis of National Health Workforce Dataset (DOH 2020b) (Table 2.1)
Telehealth is the use of information and communication technologies, such as videoconferencing, to deliver health services and transmit health information (DoH 2015). Benefits of telehealth services include:
- Increasing access to health services for people living in regional, rural and remote areas
- Reducing health related transport needs
- Increasing health services in an area with minimal increased cost
- Potentially reducing unnecessary hospitalisations (DoH 2014).
Recognising that telehealth removes some of the barriers to accessing medical services for Australians who have difficulty getting to a specialist, certain telehealth services are subsidised by Medicare (Services Australia 2020). Since 2015, residents in areas outside a major city living more than 15km from specialist eye care services have been eligible for optometrist facilitated telehealth consultations with an ophthalmologist under the MBS.
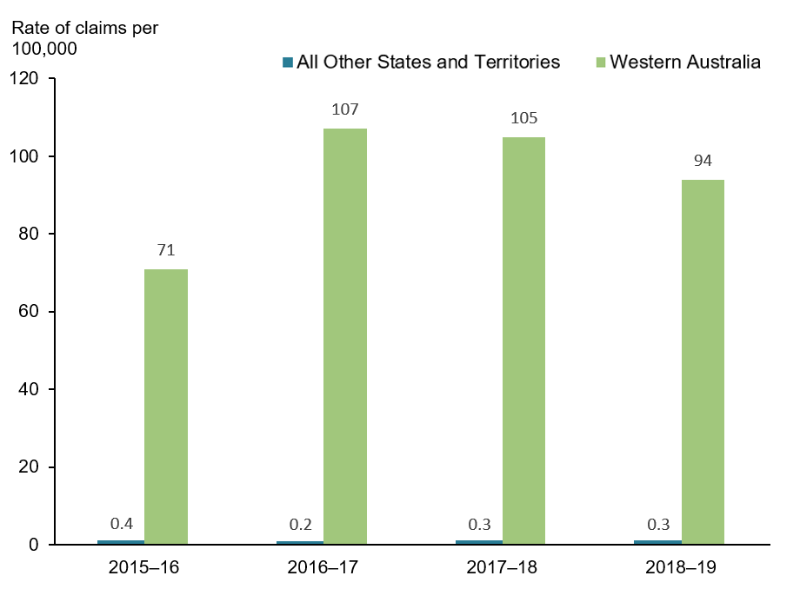
Almost all Medicare claims for telehealth ophthalmology services come from Western Australia (WA) (Figure 2). WA is the largest state in Australia by geographical area, most of which is rural and remote beyond the greater Perth metropolitan area. In some parts of remote WA, eye specialist coverage is almost twenty times lower than in a major city (Turner et al 2014). Telehealth ophthalmology services, spearheaded by the not-for-profit group Lions Outback Vision, have been promoted in response to this challenge. Out of almost 7,400 patient consultations conducted by Lions Outback Vision in 2017, more than 1,500 were managed by telehealth (RANZCO 2018b).
Figure 2: Eye health telehealth consultations in areas outside a major city, 2015–16 to 2017–18
Notes:
- Billed under MBS item numbers 10945 or 10946.
- MBS items 10945 and 10946 have been available since 1 September 2015. They are eligible to be claimed by optometrists when they present together with a patient, while participating in a video conferencing consultation with a specialist practising in ophthalmology. The patient must be located in a telehealth eligible area and at least 15km by road from the specialist, or be a patient of an Aboriginal Community Controlled Health Service or Aboriginal Medical Service. For more information, see footnotes to Table 2.2.
Source: DHS 2019b (Table 2.2).
Screening and assessment
Because eye conditions can occur at any age, everyone should have their eyes tested regularly for early detection of disease. An MBS-subsidised full comprehensive eye test with an optometrist is available once every three years for anyone under 65, and annually for anyone aged 65 and over.
However, those with a family history of eye conditions, who have chronic conditions such as diabetes or high blood pressure, or who take certain medications which increase their risk of eye disease should be reviewed more often (Vision 2020 Australia 2020).
Diabetes
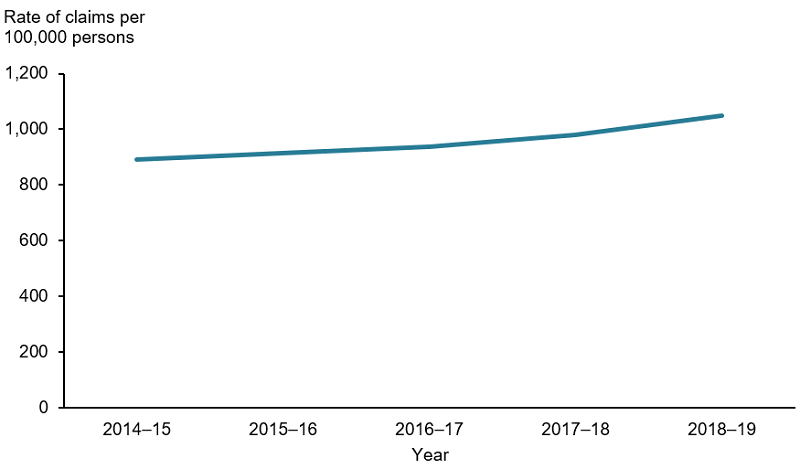
National Health and Medical Research Council guidelines recommend that all Aboriginal and Torres Strait Islander people with diabetes should have their eye health checked by an optometrist or ophthalmologist annually, while non-Indigenous Australians with diabetes should do so at least every 2 years (Mitchell et al. 2008). The rate of dilated eye examinations for diabetic ocular health checks with optometrists has increased consistently over the last 5 years from 890 per 100,000 people in 2014–15 to 1,050 per 100,000 people in 2018–19 (Figure 3). Over the same timeframe, the estimated percentage of people in Australia with diabetes has remained similar, at 5.1% (age-standardised 4.7%) in 2014–15 and 4.9% (age-standardised 4.3%) in 2017–18 based on results from the National Health Survey (ABS 2018).
Figure 3: Dilated eye examinations for diabetes, 2014–15 to 2018–19
Note: Billed under MBS item number 10915.
Source: DHS 2019a (Table 2.3).
Low vision assessment
Primary and specialist eye care providers can refer patients with low vision or blindness to low vision services. This includes guide dog services, visual and mobility aids, occupational therapy and counselling.
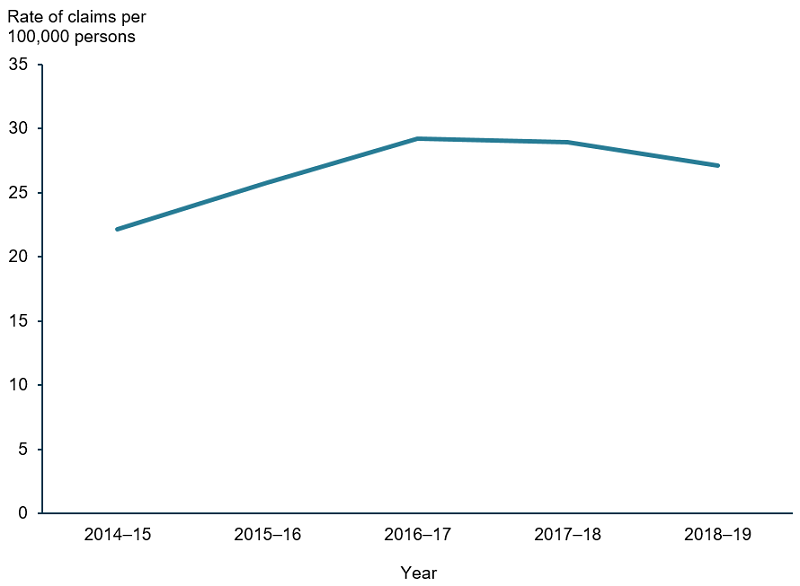
The rate of low vision assessments by optometrists to help optimise the visual performance of patients with low vision has remained steady, with 22 claims per 100,000 people in 2014–15 to 27 claims per 100,000 people in 2018–19 (Figure 4).
Figure 4: Low vision assessments, 2014–15 to 2018–19
Note: Billed under MBS item number 10942.
Source: DHS 2019a (Table 2.3)
Children’s vision assessment
In addition to a preliminary eye test after birth while a child is still in hospital, and visits to the child health nurse as an infant, most states have eye screening programs for children. This often takes place between 3.5 to 4.5 years, before the child is due to start school (Table 1). Children are referred to an optometrist or ophthalmologist if they are not meeting the expected visual standards for their age.
| Life stage | NSW | VIC | QLD | SA | WA | TAS | ACT | NT |
|---|---|---|---|---|---|---|---|---|
| Infant |
|
 |
 |
 |
 |
 |
 |
 |
| Before primary school |  |
 |
 |
 |
 |
|||
| Between start of school and year 3 |  |
 |
Note: Please see the health department website for each state or territory for more information.
Source: ACT Health 2018. CHQHHS 2020. DoH 2008. NSW Health 2020. SVRC 2020. TAS Health 2020. WA Health 2020.
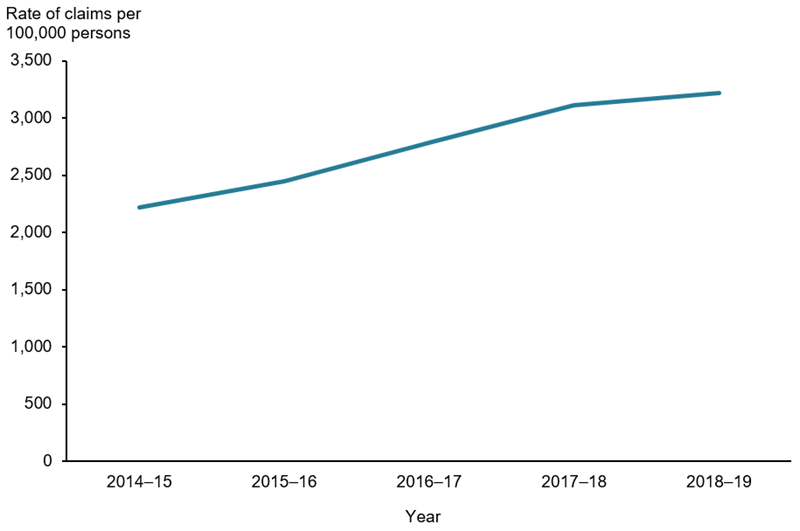
Disorders of ocular muscles, binocular movement and accommodation (focusing ability) are common among children and adolescents (see Hospitalisations below). The rate of children’s vision assessments by optometrists to diagnose and manage these conditions has increased at a steady rate from 2,200 per 100,000 children aged 3–14 in 2014–15 to 3,200 in 2018–19 (Figure 5).
Figure 5: Vision assessment, children aged 3–14, 2014–15 to 2018–19
Note: Billed under MBS item number 10943.
Source: DHS 2019a (Table 2.3).
Specialist treatments
Surgery
Surgery is considered standard treatment for ocular conditions such as cataract, and final-line treatment in other conditions such as glaucoma, where medication and other therapies fail to achieve the desired outcome.
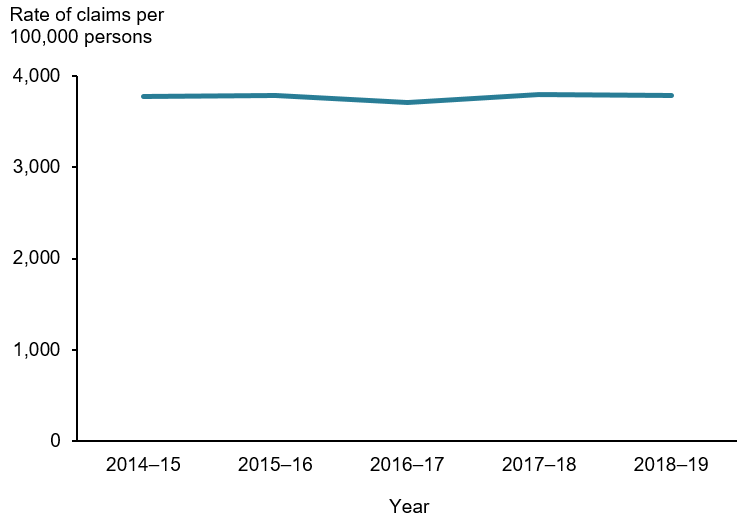
Nationwide, the rate of MBS-subsidised cataract operations (item numbers 42698, 42702 and 42705) has remained steady between 2014–15 to 2018–19 (about 3,800 per 100,000 people aged 65 and over) (Figure 6). Note this does not include public surgeries completed through public hospitals.
Figure 6: Standard cataract operations, people aged 65 and over, 2014–15 to 2018–19
Note: Billed under MBS item numbers 42698, 42702 and 42705.
Source: DHS 2019c (Table 2.3).
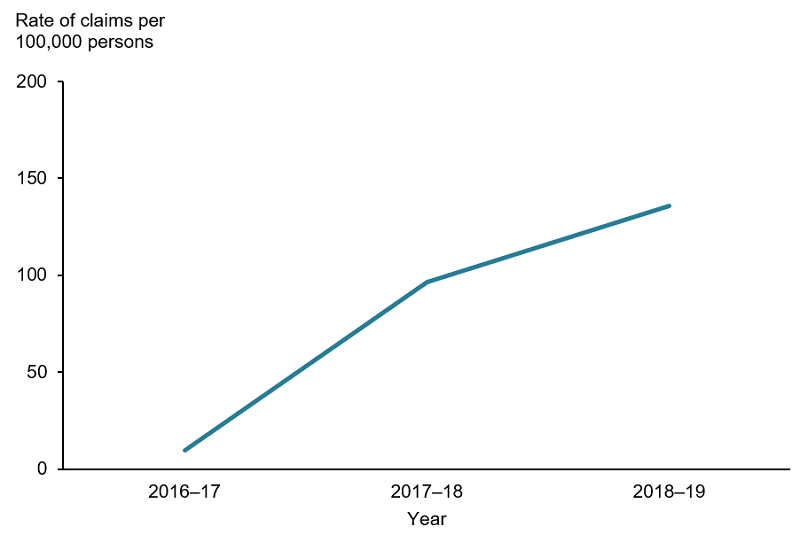
The rate of operations billed under MBS item number 42705 per 100,000 people aged 65 and over, for glaucoma-cataract combination treatment surgeries, has increased steadily since the code was introduced in 2016–17 (Figure 7). Having glaucoma does not increase the risk of cataract or vice versa. However, as both conditions are more prevalent in older patients, combination procedures reduce the need for the same patient to undergo multiple surgeries.
Figure 7: Glaucoma-cataract combination treatment operations, people aged 65 and over, 2016–17 to 2018–19
Note: Billed under MBS item number 42705.
Source: DHS 2019c (Table 2.3).
Based on National Elective Surgery Waiting Times Data, more than 100,000 admissions from waiting lists for elective eye surgery were made in 2018–19, a 2.2% increase from 2017–18. Cataract procedures recorded the highest number of admissions (72,270) when compared to other routinely monitored elective surgeries. Nationwide in 2018–19, 90% of patients were admitted after waiting 334 days for elective eye surgery through public hospitals, though wait-times differed by state (90% of people received surgery in less than 134 days in Victoria, compared with 449 days in Tasmania) (AIHW 2019b).
A review by the Australian Commission on Safety and Quality in Health Care found significant regional variation in cataract surgery rates across Australia, with a four-fold difference found between the areas with the highest and lowest rates (ACSQHC 2017). For more information on this review, please see the Second Australian Atlas of Healthcare Variation 2017.
Intraocular injections
Eye injections are used to treat uncontrolled blood vessel growth in the eye. This can occur in wet macular degeneration, diabetic retinopathy and blood vessel occlusions.
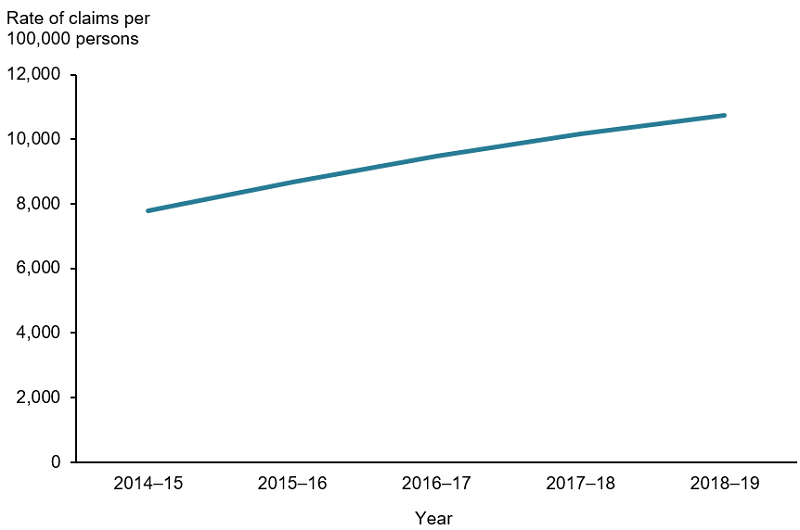
Nationwide the rate of intraocular injections per 100,000 people aged 65 and over has increased steadily since 2015 (Figure 8).
Figure 8: Intraocular injections, people aged 65 and over, 2014–15 to 2018–19
Note: Billed under MBS code 42738 and 42739.
Source: DHS 2019c (Table 2.3).
Hospitalisations
Based on AIHW analysis of data from the National Hospital Morbidity Database, about 448,000, or 4% of total hospitalisations in 2017–18 were related to the eye and ocular-adnexa (bone, muscles, nerves and other tissues surrounding the eye). Injuries and cancers each accounted for about 2% of total eye related admissions, while disorders of the eye and surrounding muscles and nerves accounted for the remaining 96%.
Males accounted for a greater proportion of ocular injury (58%) and ocular cancer (54%) admissions, while females accounted for a greater proportion of ocular disorder admissions (55%) (Table 2.4).
For information regarding hospitalisations of Aboriginal and Torres Strait Islander people for eye diseases and injuries, please see Indigenous eye health measures 2018.
Injuries
Data from Safe Work Australia’s National Data Set for Compensation-Based Statistics shows 870 serious claims made for eye-related injury or disease in 2017–18 financial year. Injuries to the eye accounted for 20% of all serious claims for chemical and substance injuries (Safe Work Australia 2020). For more information, see Eye injuries in Australia 2010–11 to 2014–15.
Hospital sector
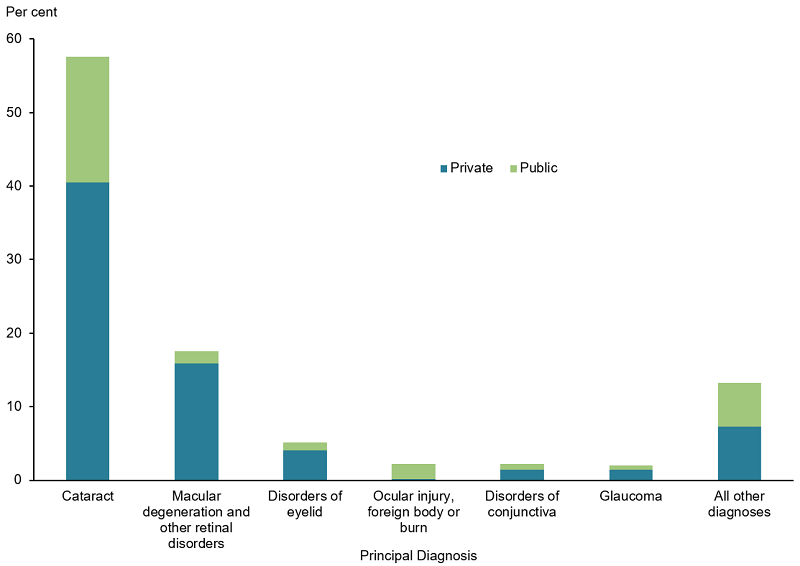
In 2017–18, private hospitals accounted for 7 in 10 (71%) hospitalisations involving the eye and surrounding tissue because private hospitals provided most of the treatment for the most common diagnoses. For example, private hospital treatment for the two most common principal diagnoses, cataracts and retinal disorders, accounted for 56% of Australia’s eye related hospitalisations (Figure 9).
Public hospitals usually treated the less common diagnoses. Public hospitals almost always treated diagnoses requiring emergency care, such as injuries, foreign bodies or burns to the eye and surrounding tissue (93%) (Table 2.5).
Figure 9: Eye health hospitalisations by principal diagnosis and hospital sector, 2017–18
Source: AIHW. National Hospital Morbidities Database 2017–18 (Table 2.5).
Access to hospital care
After adjusting for age, the rate of eye-related hospitalisations was highest for those living in the highest socioeconomic areas (around 1,610 per 100,000 people) and lowest for those from the lowest socioeconomic areas (around 1,480 per 100,000 people) (Figure 10). Rather than reflecting the underlying rate of eye conditions in these populations, this trend likely reflects increased ability to access care in private hospitals by those in higher socioeconomic areas, which account for the majority of eye health hospitalisations (Figure 9).
The rate of total hospitalisations with eye or adnexa related principal diagnosis per 100,000 people was higher in Major cities than Regional or Remote areas (Figure 10). This was true across every age group (Table 2.6).
Figure 10: Rate of hospitalisations with eye related principal diagnosis by remoteness and socioeconomic area, 2017–18
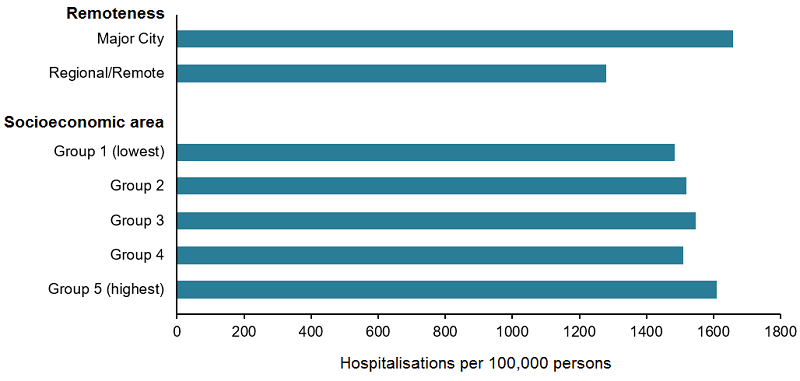
Note: Rates are age-standardised to the Australian population as at 30 June 2001.
Source: AIHW. National Hospital Morbidity Database 2017–18 (Table 2.6).
ABS 2018. National Health Survey: First Results, 2017–18. ABS cat. no. 4364.0.55.001. Canberra: ABS.
ABS 2019. Microdata: National Health Survey, 2017–18, ABS cat no. 4324.0.55.001. Findings based on Expanded CURF analysis. Canberra: ABS.
ACSQHC (Australian Commission on Safety and Quality in Health Care) 2017. Second Australian Atlas of Healthcare Variation, Chapter 4, Surgical Interventions. Sydney: ACSQHC.
ACT Government Department of Health (ACT Health) 2018. Eye Screening. Canberra: ACT Government. Viewed online 10 November 2020.
AIHW (Australian Institute for Health and Welfare) 2019a. Indigenous eye health measures 2018. AIHW cat. no. IHW 210. Canberra: AIHW.
AIHW 2019b. Elective Surgery Activity. Canberra: AIHW. Viewed on 23 June 2020.
Britt H, Miller GC, Bayram C, Henderson J, Valenti L, Harrison C et. al. A decade of Australian general practice activity 2006–07 to 2015–16 . General practice series no. 41. Sydney: Sydney University Press, 2016.
Children’s Health Queensland Hospital and Health Service (CHQHHS). Primary School Nurse Health Readiness Program - Vision Screening. Brisbane: Queensland Government. Viewed 10 November 2020.
DOH (Department of Health) 2005. The delivery of eye health programs and services. (ed., Health Do). Canberra:DoH.
DOH 2008. National framework for action to promote eye health and prevent avoidable blindness and vision loss progress report – key action area two: increasing early detection. Canberra: DOH. Viewed online 10 Nov 2020.
DOH 2014. Telehealth Pilots Programme. Canberra: DoH. Viewed online 10 Nov 2020.
DOH 2015. Telehealth. Canberra: DoH. Viewed online 10 Nov 2020.
DOH 2020a. Annual Medicare Statistics (Tables 1.1, 1.6). Canberra:DoH. Viewed 19 February 2020.
DOH 2020b. National Health Workforce Dataset. Canberra: DoH. Viewed 3 November 2020.
Foreman J, Xie J, Keel S, Wijngaarden P, Sandhu SS, Ang GS et al. 2017. The prevalence and causes of vision loss in Indigenous and non-Indigenous Australians: The National Eye Health Survey. Ophthalmology 124 (12):1743–1752.
Government of Western Australia Department of Health (WA Health). Community Child Health Program. Perth: Government of Western Australia. Viewed online 10 Nov 2020.
Mitchell P ,Foran S, Wong TY, Chua B, Patel I, Ojaimi B. 2008. Guidelines for the management of Diabetic Retinopathy. Canberra: National Health and Medical Research Council
NSW Government Department of Health (NSW Health). 2020. Statewide Eyesight Preschooler Screening. Sydney: NSW Government. Viewed online 10 November 2020.
Optometry Australia 2019. GPs & health care professionals. Canberra: Optometry Australia.
Optometry Board of Australia 2018. 2018 Revised guidelines for use of scheduled medicines. Canberra: Australian Health Practitioner Regulation Agency.
RANZCO (Royal Australian and New Zealand College of Ophthalmologists) 2018a. Policies and Guidelines Sydney: Royal Australian and New Zealand College of Ophthalmologists. Viewed 19 February 2020.
RANZCO 2018b. Telehealth Awareness Week – Western Australia. Viewed online 11 November 2020.
RANZCO 2019. RANZCO Clinical Practice Guidelines Development Framework. Sydney: Royal Australian and New Zealand College of Ophthalmologists.
Safe Work Australia 2020. Australian Workers’ Compensation Statistics 2017–18. Canberra: Safe Work Australia. Viewed 16 June 2020.
Services Australia 2020. MBS and telehealth. Canberra: Services Australia. Viewed online 10 Nov 2020.
Statewide Vision Resource Centre (SVRC) 2020. Getting assessed for vision impairment. Melbourne: Victorian Government Department of Education and Training. Viewed online 10 November 2020.
Tasmanian Government Department of Health (Tas Health). Child Health and Parenting – Healthy Kids Check. Hobart: Tasmanian Government. Viewed online 10 November 2020.
Turner A, Razavi H, Copeland S 2014. Increasing the impact of telehealth for eye care in rural and remote Western Australia. Perth: Lions Eye Institute.
Vision 2020 Australia. Booking an eye test. Melbourne: Vision 2020 Australia. Viewed online 16 June 2020.


