International comparison
Each country’s experience of the pandemic was different in terms of timing, health impacts and financial impacts. Australia recorded the first confirmed case of COVID–19 virus in January 2020 and since then implemented strict containment measures including border controls, quarantine for returning travellers, and social distancing measures. Various states and territories imposed lockdowns and restrictions as needed.
Australia’s early response helped flatten the curve keeping the number of cases initially low compared to many other countries and continued to be flat during the initial outbreak of Omicron in December 2021 (AIHW 2022b). Other countries, such as the United States and the United Kingdom, had a much more even distribution of COVID–19 across 2020–2023.
OECD comparison of health system spending during COVID–19
Over the four calendar years most impacted by the pandemic (2020 to 2023), health system spending increased for almost all Organisation for Economic Co-operation and Development (OECD) countries compared to the forecast trend. Figure 12, compares the percentage change in US dollars per person, purchasing power parity (PPP) converted, in current prices, compared to the pre-COVID trend for each country. It shows that Australia’s health expenditure was 9.2% higher than expected over the period 2020 to 2023 based on a linear forecast of the ten years preceding COVID–19.
What is purchasing power parities (PPPs)?
The cost of health goods and services can vary greatly from one country to another due to differences in price levels. PPPs adjust these costs to a common currency, and a basket of goods and services used for PPP calculations is standardized so that the same set of health goods and services are compared across countries.
Figure 12: Excess health system spending compared to pre-COVID trend, 2020 to 2023
This chart shows that Australia’s health expenditure was 9.2% higher than expected over 2020 to 2023, based on a linear forecast of the ten years preceding COVID–19. This was the fourth lowest amongst 36 OECD countries.
Downloadable data tables are available on Data.
International comparison of excess mortality
What is excess mortality?
Excess mortality compares the number of deaths recorded for a period against the expected number of deaths over the same period. In this case, the period examined is the four years 2020 to 2023. The expected number of deaths is based on the average number of deaths for the previous five years, (2015–19).
While COVID–19 had a major impact on the healthcare and health system spending in Australia, there has been less of an impact on morbidity and mortality than for many other countries (Mueller et al. 2021).
Excess mortality is a useful and available measure for the purposes of international comparison of the impact of the pandemic and while a country’s health system spending in response to COVID-19 is likely to have had an impact on excess mortality, there are many other contributing factors, such as geography and social policy, that are beyond the scope of this report.
As shown in Figure 13, Australia ranked 5 in terms of lowest percentage of excess mortality during the pandemic amongst 33 OECD countries (Our World in Data 2024a). These countries with a range of health systems and economies were chosen for comparison purpose. Australia’s total excess mortality during the period 2020 to 2023 was 4.9% higher than the expected mortality, which represents 34,729 extra deaths. Note that this figure is different to what the ABS estimated for a similar period (during the COVID-19 pandemic until August 2023), which was 24,351 extra deaths with 3.8% higher than expected mortality (ABS 2023). This is due to different methods used for estimating expected mortality and different time periods.
The excess mortality for these 33 countries combined was 8.2% during the pandemic, noting the United States’ impact on the average due to their large number of excess deaths. The United States recorded an additional 1.3 million deaths over these four years, accounting for one-third of the excess deaths amongst these 33 countries.
Figure 13: Excess mortality rate during the COVID–19 pandemic, 2020 to 2023
This chart shows that Australia’s excess mortality rate between 2020 and 2023 was 4.9% and 5th lowest among 33 OECD countries. The average was 8.2%.
Downloadable data tables are available on Data.
Excess mortality varied by year for each country during the pandemic. Figure 14 below shows that the majority of Australia’s excess mortality occurred during the third year of the pandemic (2022), which was similar to Norway and Japan. Sweden by contrast experienced the majority of its excess mortality during the first year of the pandemic. The United Kingdom’s excess mortality was more evenly distributed over the four calendar years of the pandemic 2020–2023. The United States recorded a greater share of their excess mortality during 2020 and 2021.
Figure 14: Contribution to excess mortality by year, 2020 to 2023

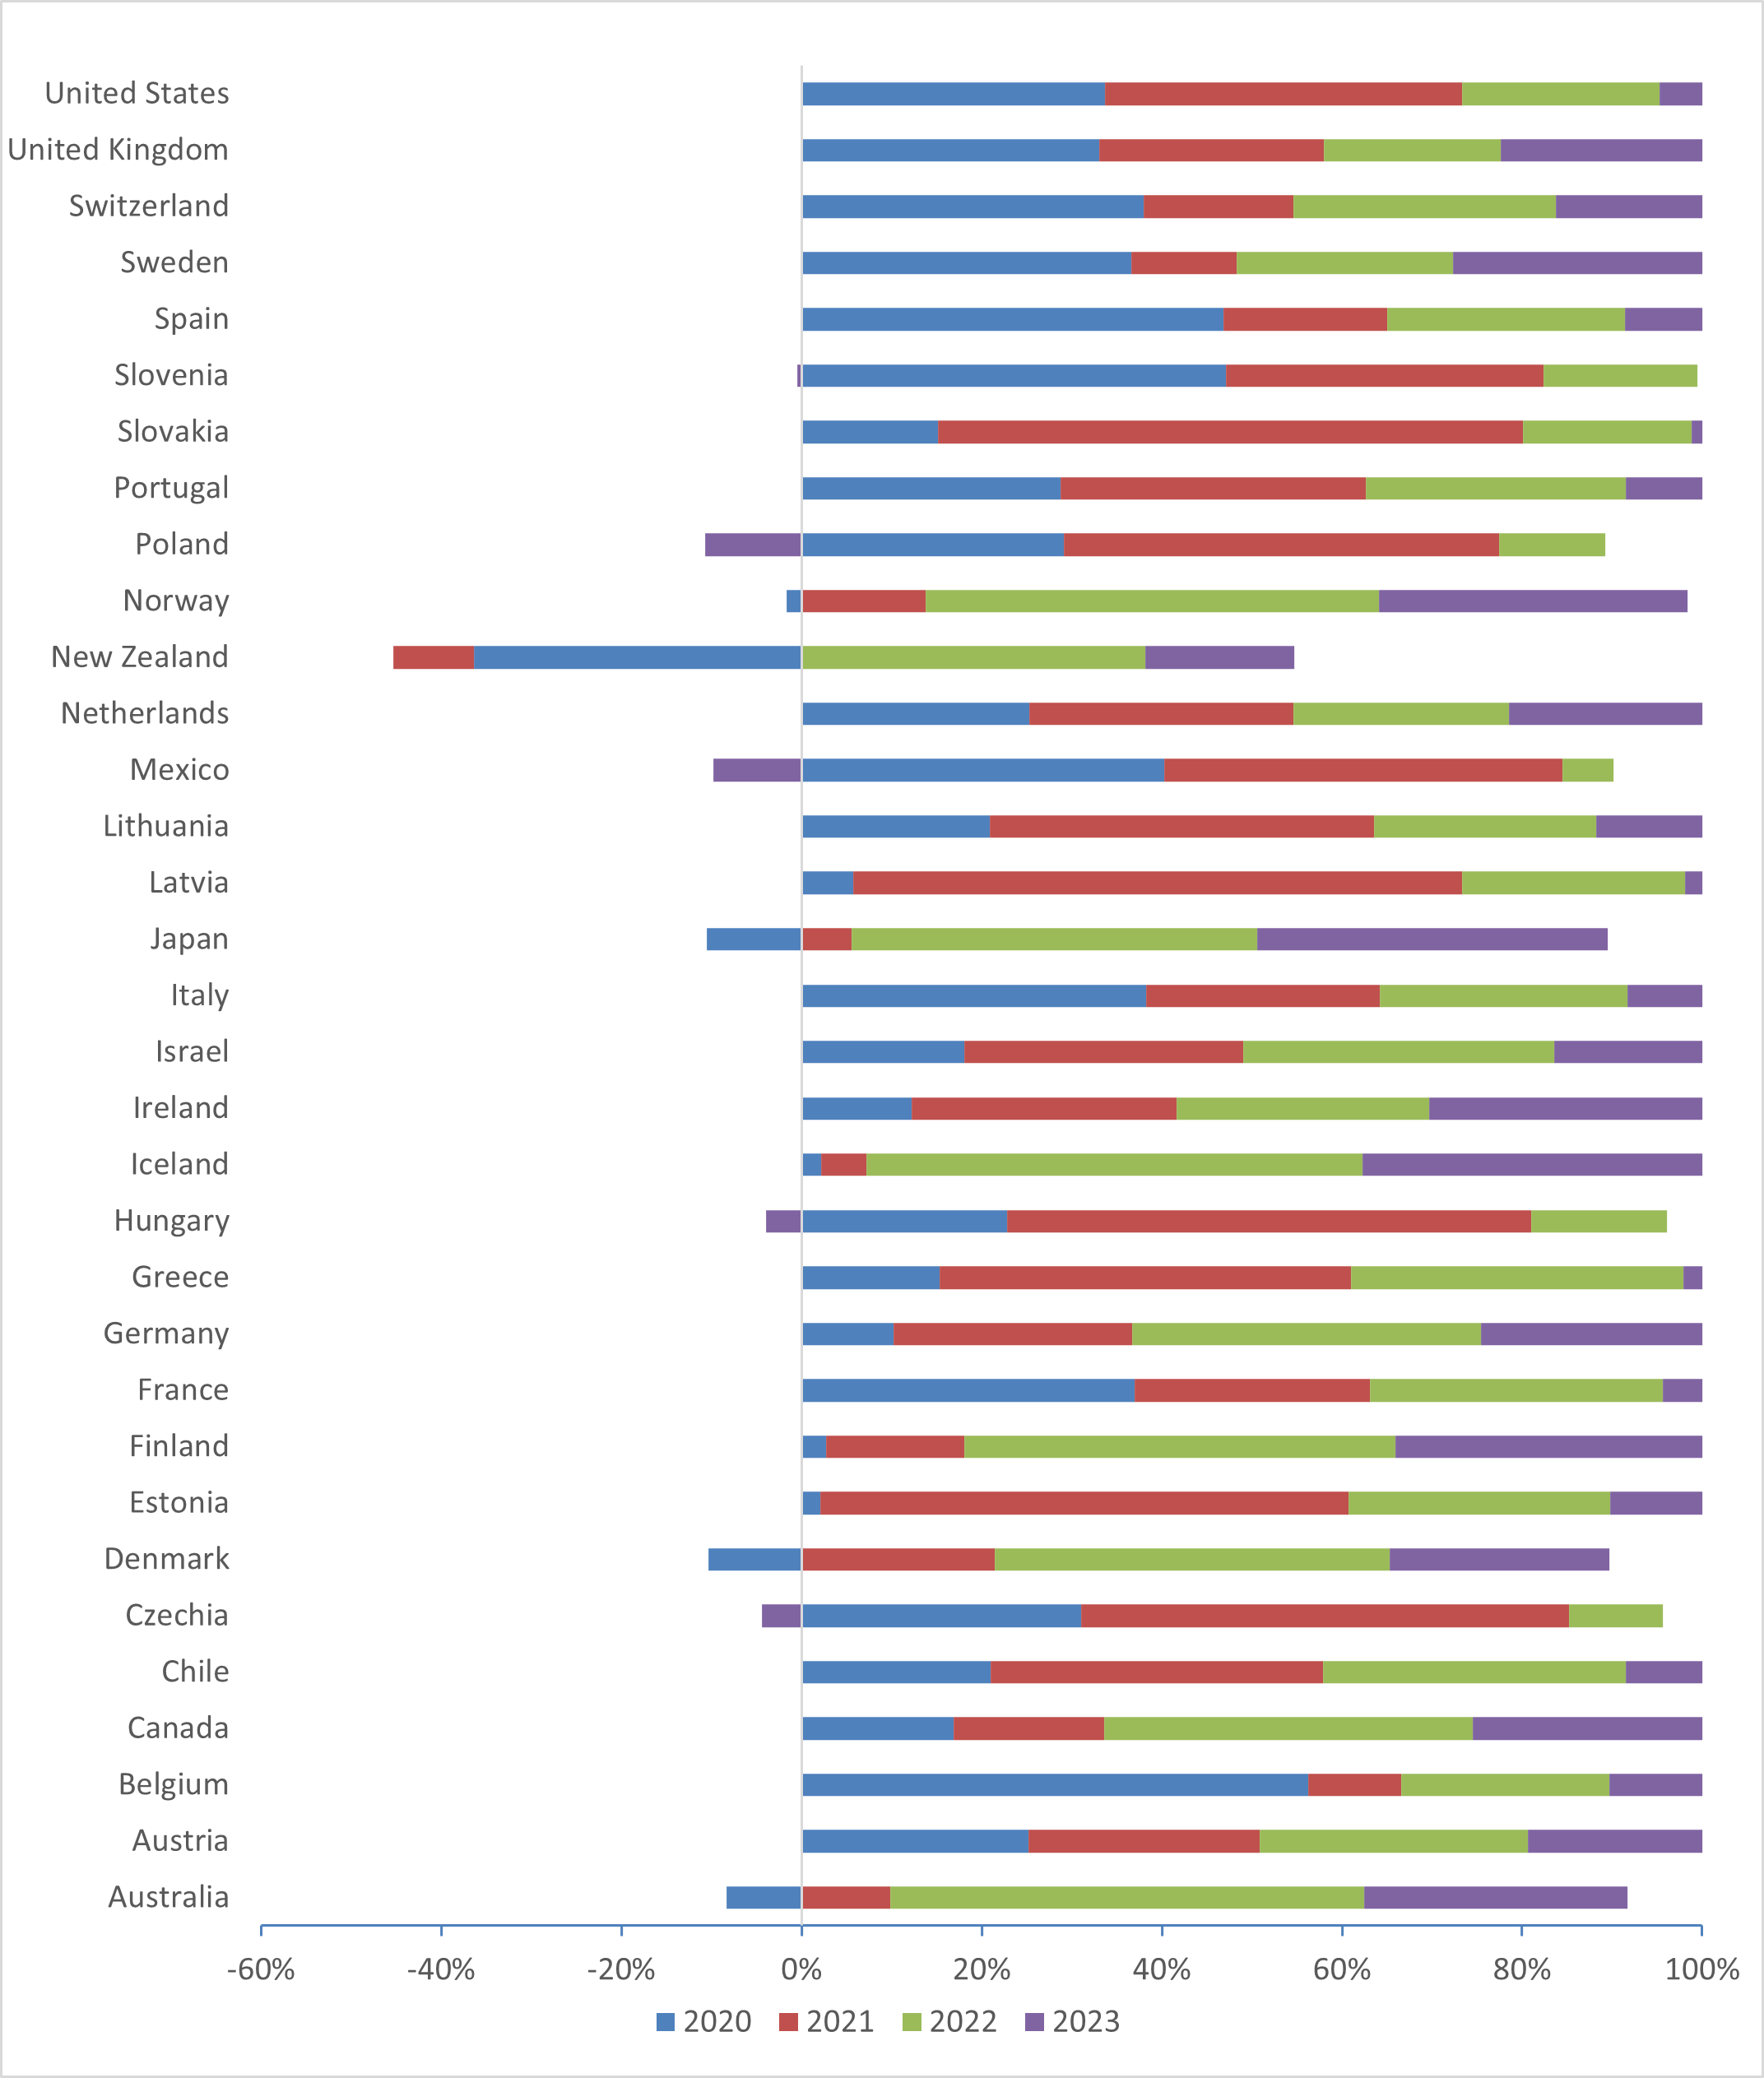
Source: Our World in Data (2024).
Notes: Australia, Denmark, Japan and Norway had lower than expected deaths in 2020, that is, negative excess mortality. New Zealand had lower than expected deaths in both 2020 and 2021. Poland, Mexico, Hungary and Czechia had lower than expected deaths in 2023.
ABS (Australian Bureau of Statistics) (2023), Measuring Australia's excess mortality during the COVID-19 pandemic until August 2023, ABS, Australian Government, accessed 10 July 2024.
AIHW (2022b), Australia’s health 2022: data insights, AIHW, Australian Government, accessed 07 October 2023.
Mueller, M., et al. (2021), The health impact of COVID‑19, in Health at a Glance 2021: OECD Indicators, OECD Publishing, Paris, doi:10.1787/b0118fae-en.
Our World in Data (2024a) Excess mortality: Cumulative deaths from all causes compared to projection based on previous years, accessed 16 May 2024.