Clients, services and outcomes
Key findings and insights
In 2023–24:
- Almost 280,100 clients were assisted by specialist homelessness agencies, an increase from 236,400 clients in 2011–12 – an average annual increase of 1.4% per year.
- The rate of SHS clients was 105.1 per 10,000 population, a decrease from the peak of 119.2 clients in 2016–17.
- More people (37,800 clients) were experiencing persistent homelessness, compared with 29,500 clients in 2018–19, particularly clients aged under 25 (18,100) and women and children affected by family and domestic violence (15,700).
- SHS clients who have experienced family and domestic violence was the largest cohort of SHS clients, making up over 39% of all SHS clients.
- The number of SHS clients with a current mental health issue has increased; 88,300 (around 32% of all SHS clients) in 2023–24, compared with 86,500 (30%) in 2018–19.
Specialist homelessness agencies provide a variety of services to assist people who are experiencing homelessness or who are at risk of homelessness, ranging from general support and assistance to immediate crisis accommodation. Characteristics of all clients assisted by specialist homelessness services (SHS) in 2023–24 are described below, including their need/s for assistance and the services they received.
It is important to note, the number of clients supported by SHS agencies reflects the agency engagement of people which is not necessarily a reflection of the underlying level of homelessness, or people at risk of homelessness, in Australia.
Characteristics of clients
SHS clients were more likely to be female (60%); adult clients were most likely to be aged 35–44 (25%) and 3 in 10 clients were aged under 18 (27% or 77,000) in 2023–24.
Figure CLIENTS.1: Characteristics of SHS clients, 2023–24
Dashboard shows the number of SHS clients, by sex, by states and territories, by vulnerabilities, by Indigenous status, and by living arrangements.
Age and sex
The additional category ‘Other’ was added to the question which records the person’s sex and applies to support periods and unassisted instances starting on or after 1 July 2019. When new items are added to a collection, it can take time for the new items to be considered of adequate quality to support publication.
In 2023–24, around 2,300 clients (0.8% of all clients) were recorded a sex ‘Other’.
| Males | Females | Other | All clients |
|---|---|---|---|---|
2021–22: Clients (number) | 108,263 | 163,076 | 1,355 | 272,694 |
2021–22: Clients (per cent) | 39.7 | 59.8 | 0.5 | 100.0 |
2022–23: Clients (number) | 111,202 | 160,686 | 1,760 | 273,648 |
2022–23: Clients (per cent) | 40.6 | 58.7 | 0.6 | 100.0 |
2023–24: Clients (number) | 112,873 | 164,896 | 2,309 | 280,078 |
2023–24: Clients (per cent) | 40.3 | 58.9 | 0.8 | 100.0 |
Other than for the data presented above, for the 2023–24 Annual Report these clients were combined with the ‘Female’ category for reporting purposes only. For further information, see the Technical notes.
In 2023–24 (Supplementary tables CLIENTS.1):
- The majority of SHS clients were female (60% or 167,200 clients).
- The largest age group was clients aged 25–44 (36% or 101,000).
- 3 in 10 clients were aged under 18 (27% or 77,000).
- The overall rate of SHS clients was higher for females: 1 in 80 females in the Australian population received support compared with 1 in 117 males.
- The highest rate of clients among all age groups were those aged 15–17 years: higher for females (197.4 per 10,000 population) than for males (128.6 per 10,000 population).
Indigenous status
In 2023–24, Aboriginal and Torres Strait Islander (First Nations) people were over-represented among SHS clients. Of those clients who provided information on their Indigenous status (Supplementary table INDIGENOUS.2):
- Around 1 in 3 (29% or almost 78,300 clients) identified as being of Aboriginal and/or Torres Strait Islander origin.
- This equated to 839.6 First Nations clients per 10,000 Indigenous population compared with 80.2 for non-Indigenous clients.
For further information please see Indigenous clients.
State and territory
Noting that clients may have accessed services in more than one state or territory throughout the year (Supplementary table CLIENTS.1):
- The largest number of clients received services in Victoria (102,000), followed by New South Wales (67,900) and Queensland (48,800).
- The highest rate of SHS clients was in the Northern Territory (398.5 clients per 10,000 population), followed by Victoria (149.5) and Tasmania (116.3).
- Females had higher rates of service use than males across all states and territories; the Northern Territory had the most pronounced difference between females (537.0 per 10,000 females) and males (263.6 per 10,000 males).
Main source of income
Income support was high among SHS clients aged 15 and over. At the time clients first received support in 2023–24 (Supplementary table CLIENTS.16):
- Four-fifths (77%) of clients received some form of government payment (including awaiting a government payment) as their main source of income.
- Around 1 in 10 (12%) clients reported income from employment as their main source.
- Fewer than 1 in 10 (9.5%) clients reported having no income.
The most common government payments were JobSeeker (28% or 55,300 clients), Parenting Payment (17% or 33,700) and Disability Support Pension (15% or 29,000).
Of those clients aged 15 and over who needed assistance to obtain/maintain government allowance or employment assistance:
- fewer clients reported no income (7.6%) at the end of support compared with at the start of support (12%), and
- the proportion waiting for government benefits nearly halved from 5.2% to 2.6% (Supplementary table CLIENTS.35).
Labour force and Education enrolment status
Of those clients aged 15 or over and whose labour force status was known, at the beginning of support in 2023–24 (Supplementary tables CLIENTS.19):
- Almost one-fifth (17% or 33,100) were employed, and the majority (19,600) were employed on a part-time basis.
- More than half (51% or 101,600) were unemployed; males (55%) were more likely to be unemployed than females (49%).
- Almost one-third (32% or 63,100) were not in the labour force.
Employment increased following support. Of those clients who needed employment assistance, 19% were employed at the start of support and 26% were employed at the end of the support (Supplementary table CLIENTS.34).
Of those clients aged 5–24 whose educational status was known in 2023–24 (Supplementary table CLIENTS.18):
- More than half (55% or 45,700) of clients were enrolled in some form of education.
- Around 9 in 10 (91% or 31,100) of clients aged 5–14 were enrolled in school or other types of education.
- Around 7 in 10 (70% or 33,800) clients aged 15–24 were not in some form of education.
Living arrangements
The most common living arrangement reported by SHS clients at the beginning of support in 2023–24 was lone parent with one or more children (34% or 92,300 clients), followed by lone persons (34% or 91,000) and other family groups (12% or 32,200) (Supplementary table CLIENTS.10).
- Female clients (41%) were more likely to be living as a single parent with one or more children than male (25%) clients.
- Males (44%) were more likely than females (27%) to be living alone.
Clients’ reasons for assistance
SHS clients commonly sought assistance because of accommodation issues (55%), financial difficulties (41%) and housing crisis (37%) in 2023–24.
One-quarter (26%) of SHS clients identified family and domestic violence as the main reason for seeking SHS services in 2023–24.
The SHSC includes information about clients’ needs for services from two perspectives:
- The client’s reasons for seeking assistance at the start of support – both the main reason for seeking support and all reasons for seeking support are collected.
- The agency worker’s assessment of the client’s needs – this information is captured when clients first present for assistance and each month while a client is still in contact with the agency.
Technical notes and Glossary provide more information about how clients’ needs for assistance are captured in the SHSC. Services provided and unmet demand provides further information about clients’ needs that were provided and that went unmet.
SHS clients commonly sought assistance in 2023–24 as a result of (Supplementary table CLIENTS.21):
- accommodation issues (including housing crisis, inadequate or inappropriate dwelling conditions or that previous accommodation had ended) (55% or 154,200 clients)
- financial difficulties (41%, 114,200)
- housing crisis (37%, 104,000)
- family and domestic violence (37%, 102,100)
- housing affordability stress (36%, 99,400).
The most common main reasons for seeking assistance in 2023–24 were (Figure CLIENTS.7, Supplementary table CLIENTS.22):
- family and domestic violence (26% or 71,800 clients). For more information, see Clients who have experienced family and domestic violence.
- housing crisis (19% or 52,100).
Figure CLIENTS.2: Main reason for seeking assistance (top 6), by homelessness status, 2023–24
Stacked bar chart shows the most common main reasons for seeking assistance are Family and domestic violence (71,846) and Housing crisis (52,114).
In 2023–24, among those clients experiencing homelessness when they first started receiving support, the most common main reasons for seeking assistance were (Supplementary table CLIENTS.23):
- housing crisis (23% of homeless clients)
- inadequate or inappropriate dwelling conditions (19%)
- family and domestic violence (18%).
For those clients at risk of homelessness, the most common main reasons for seeking assistance were:
- family and domestic violence (30% of clients at risk of homelessness)
- housing crisis (17%)
- financial difficulties (14%).
Patterns of service use in 2023–24
More than three-fifths (64% or 177,900) of all SHS clients either continued to access SHS support in 2023–24, or they returned to SHS support after not receiving it for a period of time.
More people (37,800 clients) were experiencing persistent homelessness in 2023–24 compared with 2018–19 (29,500 clients), particularly clients aged under 25, women and children affected by family and domestic violence, and First Nations people.
Flow of clients into and out of SHS support
Clients can have varied pathways into and out of SHS support. Some clients have not previously received SHS support, some have received SHS support in the past and not needed support again until recently, and others continue to need consecutive periods of support each year.
In 2023–24 (Figure CLIENTS.3, Supplementary tables CLIENTS.2 and CLIENTS.40):
- Over one-third (37% or 102,200) of clients had not previously received SHS support (since the collection began in July 2011).
- More than two-fifths (43% or 119,200) of clients continued to receive support, after also receiving support in 2022–23.
- One in 5 (21% or 58,700) clients returned to SHS support after not having received support in the previous 12 months.
- Almost three-quarters (73% or 204,400) of clients ended their support in 2023–24.
Figure CLIENTS.3: Clients by service user group, 2023–24
Bar chart shows the most common groups are Exiting clients with closed support (204,350), Continuing clients (119,175), and New clients (102,203).
First time clients
Of the 102,200 first time SHS clients in 2023–24 (that is, they had not received SHS support at any time since July 2011) (Supplementary tables CLIENTS.2 and CLIENTS.39):
- Around half (46% or 43,400) were experiencing homelessness at the beginning of their first support period in 2023–24. The top 3 main reasons for needing assistance among new clients experiencing homelessness were:
- housing crisis (22%, or 9,500 new clients experiencing homelessness)
- family and domestic violence (21% or 8,900)
- inadequate or inappropriate dwelling conditions (17% or 7,100).
- The top 3 main reasons for needing assistance by new clients who were at risk of homelessness were:
- family and domestic violence (35% or 17,900 new clients at risk of homelessness)
- housing crisis (16% or 8,300)
- financial difficulties (13% or 6,600 clients).
Ongoing and repeat homelessness
For some people, a period of insecure housing can be short lived; for others, ongoing or chronic homelessness can be a feature of their lives. Even with the support of specialist services, people may experience homelessness for long periods of time or cycle in and out of homelessness (AIHW 2023). People experiencing repeat episodes of homelessness are a priority cohort in the National Housing and Homelessness Agreement (NHHA) (CFFR 2018).
- The number of people experiencing persistent homelessness (more than 7 out of 24-months homeless while a client of a SHS agency) increased from 29,500 clients in 2018–19 to 37,800 in 2023–24. Increases were particularly evident among clients aged under 25 (around 18,100 clients) and women and children affected by family and domestic violence (15,700).
- The number of people experiencing a return to homelessness after a period of more secure housing (homeless, housed and then homeless again) fell from around 15,900 clients in 2018–19 to around 14,700 in 2023–24.
For further information see National Housing and Homelessness Agreement Indicators
Length of support
Data collected by specialist homelessness agencies are based on support periods (see Technical notes for further information). Clients may have had more than one support period in 2023–24, either with the same agency at different times or with different agencies, and the length of support required within a support period may vary depending on the complexity of clients’ needs.
In 2023–24:
- SHS clients had over 485,600 support periods, an average annual increase of 1.9% each year since 2011–12 (Historical table HIST.CLIENTS).
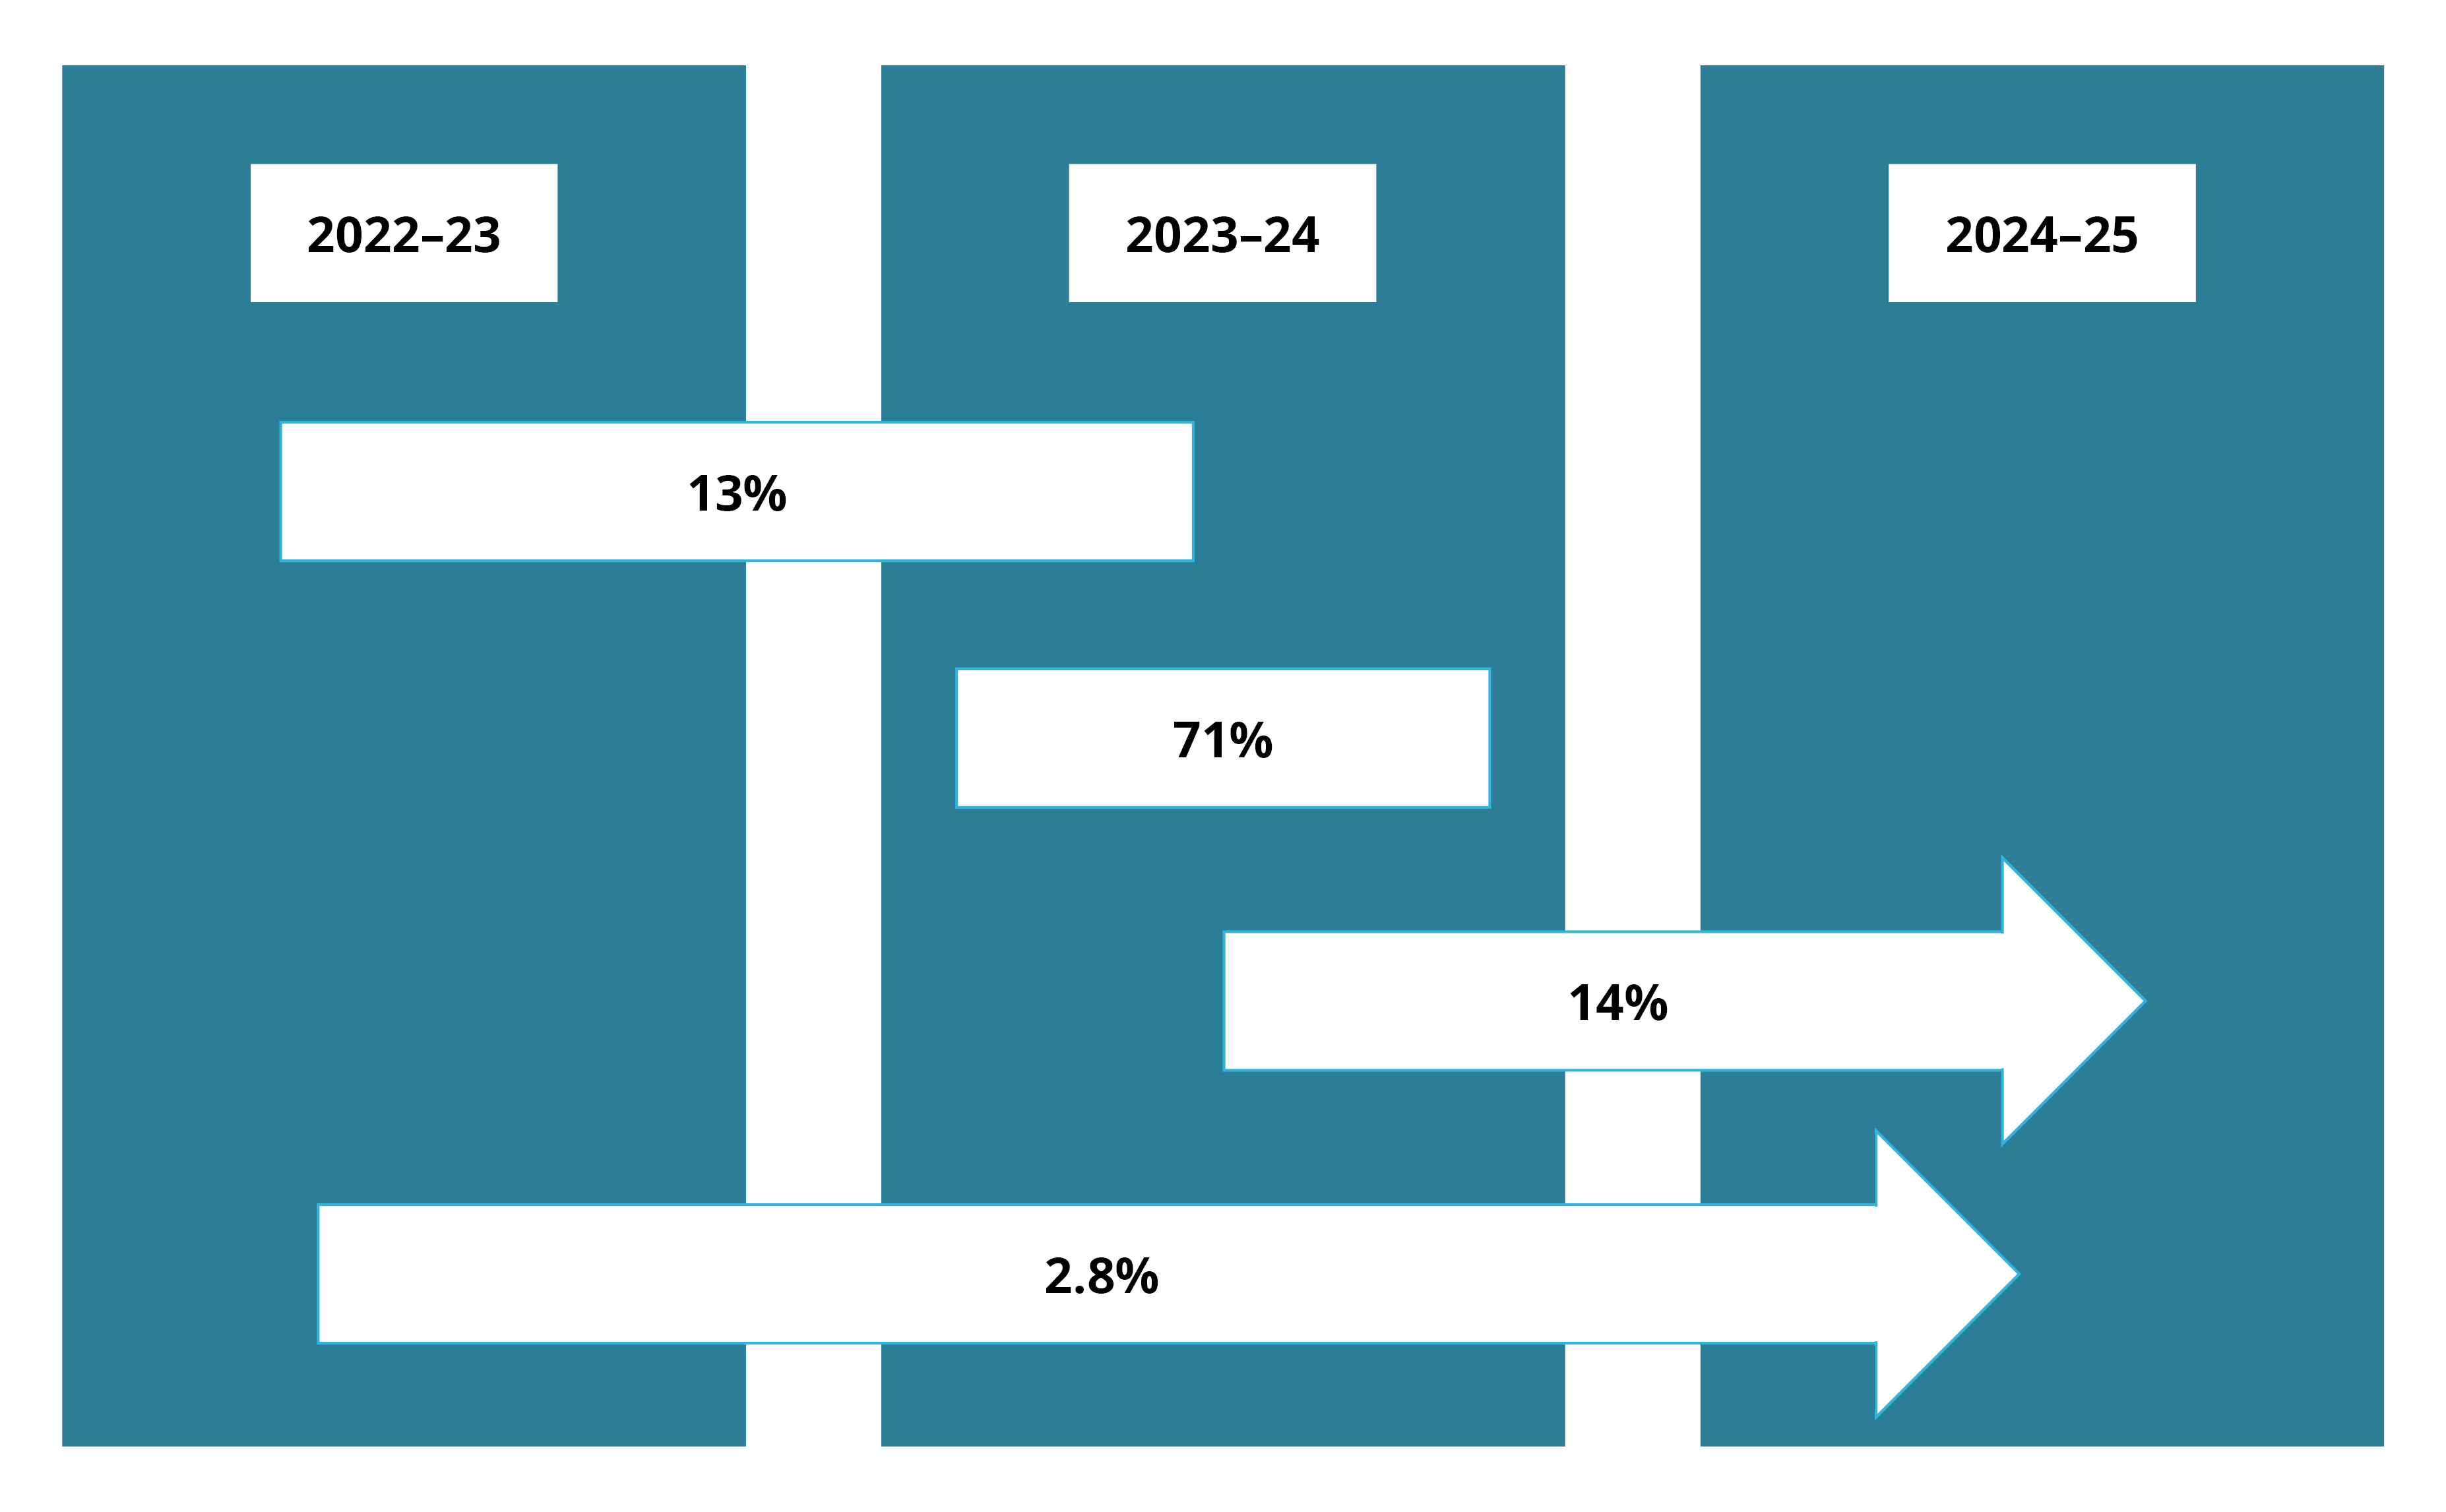
- The majority of support periods were opened and closed within 2023–24 (71% or around 342,600). An additional 14% of support periods opened during the year and remained open on 30 June 2024. A small proportion (2.8%) were ongoing throughout the 2023–24 reporting period (Figure CLIENTS.4, Supplementary table CLIENTS.28).
- Two-thirds (65%) of clients had only one support period, 1 in 5 (20%) had 2 support periods, 7.5% had 3 support periods and 7.8% had 4 or more (Supplementary table CLIENTS.27).
- The median number of support days for clients was 58 days; females had more support days (61 days) than males (53 days) (Supplementary table CLIENTS.29).
- The median number of nights accommodated increased to 33 nights, up from a low of 28 nights in 2019–20 (Supplementary table CLIENTS.48).
Figure CLIENTS.4: Support periods, by indicative duration over the reporting period, 2023–24

Source: Specialist Homelessness Services Collection 2023–24, Supplementary table CLIENTS.28.
The needs of some clients can be met relatively quickly but clients with more complex needs received more support.
- Three in 10 (28% or 77,300) clients received between 6 and 45 days of support during 2023–24
- 17% received support for up to 5 days
- 18% received support for 91–180 days and 1 in 5 clients (20%) received over 180 days of support (Supplementary table CLIENTS.29).
Reasons support ended
More than half (59%) of support periods ended in 2023–24 because the client’s immediate needs were met, or case management goals were achieved (Supplementary table CLIENTS.30).
- One in 5 (21%) support periods ended because the client no longer requested assistance; that is, a client may have decided that they no longer required assistance or they may have moved from the state/territory or region.
- A further 12% of support periods closed because contact was lost with the client and 11% closed because the client was referred to another specialist homelessness agency.
Housing situation and outcomes
For SHS clients who had finished support in 2023–24, fewer clients were experiencing homelessness compared to when they started receiving support. SHS agencies supported the vast majority of clients at risk of homelessness to avoid becoming homeless.
Housing situation at first presentation
Among clients whose housing status was known at the beginning of their first support period in 2023–24 (Figure CLIENTS.5, Supplementary tables CLIENTS.11 and CLIENTS.12):
- Most clients were at risk of homelessness (52% or 138,100) rather than experiencing homelessness (48% or 125,300).
- Around 1 in 3 (89,100) clients were living in private or other housing.
- Almost 51,800 clients (29,000 females and 22,800 males) were living in short-term temporary accommodation.
- The proportion experiencing homelessness was higher among males (54%) than females (43%).
Of those clients who were rough sleeping (around 31,200 clients) at the start of support, around half (49%) were sleeping in no dwelling, either on the street, in a park or out in the open and one-quarter (22%) were sleeping in a motor vehicle (Supplementary table CLIENTS.13).
Figure CLIENTS.5: Clients by housing situation at the beginning of support, 2023–24
Bar chart shows for those clients housed, most were in private or other housing when they sought homelessness services.
Housing outcomes at end of support
Many clients had long periods of support or even multiple support periods during 2023–24. They may have had a number of changes in their housing situation over the course of their support. Outcomes presented here describe the change in clients’ housing situation at the start of their first period of support during 2023–24 compared with the end of their last period of support in 2023–24. Data are limited only to clients who stopped receiving support during the financial year and were no longer receiving ongoing support from a SHS agency (204,000 clients, or 73% of all SHS clients).
Three aspects of a client’s housing situation are considered in their housing circumstances: dwelling type, housing tenure and the conditions of occupancy. See Data presentation and derivations for details on how each of these categories are derived.
By the end of support, many clients have achieved or progressed towards a more stable housing solution. That is, clients ending support in public/community housing (renter or rent-free) or private housing (renter or rent-free) had increased compared with the start of support.
In 2023–24, of those who were known to be experiencing homelessness at the start of support (85,600 clients) (Figure CLIENTS.6 and Supplementary table CLIENTS.31):
- Fewer clients were experiencing homelessness when support ended (52,500); these clients were mostly either in short-term accommodation (21,200 clients) or were couch surfing (18,000 clients) at the end of support.
- Almost 13,300 clients ended support in private housing and 12,400 ended support in public/community housing.
In 2023–24, of those who were known to be at risk of homelessness at the start of support (102,000 clients):
- Most clients maintained their housing situation at the end of support; around 54,400 clients maintained private housing and around 24,000 clients maintained public/community housing.
- More clients were living in public/community housing (28,300 clients at the end of support compared with 28,200 clients at the beginning of support): almost 3,800 of these clients moved from private housing to avoid homelessness.
- Nearly one in 10 clients (9,400 clients) ended their support experiencing homelessness.
Figure CLIENTS.6: Housing situation at beginning and at end of support for clients with closed support, 2023–24
Sankey diagram shows clients’ housing situation from start to end of support. Most clients started and ended support in private or other housing.
AIHW (2023) ‘Homelessness and housing affordability’, Australia’s welfare: Data insights, AIHW, Australian Government, accessed 12 September 2024.
Council on Federal Financial Relations (2018) National Housing and Homelessness Agreement, CFFR website, accessed 12 September 2024.