Indigenous clients
Aboriginal and Torres Strait Islander people are more likely than non-Indigenous Australians to experience insecure housing, live in overcrowded dwellings and experience homelessness, including intergenerational homelessness. They continue to be over-represented in both the national homeless population and as users of specialist homelessness services (see Clients, services and outcomes and ABS 2012). Indigenous Australians are a national priority homelessness cohort in the National Housing and Homelessness Agreement, which came into effect 1 July 2018 (CFFR 2018) (see Policy section for more information).
Aboriginal and Torres Strait Islander people make up 3.2% of the Australian population (ABS 2019), yet they made up 26% of the clients (an estimated 68,900 clients) assisted by specialist homelessness services (SHS) in 2018–19. It is important to note that Indigenous status was not reported for 9% of SHS clients in 2018–19 (similar to 2017–18; 10%).
Key findings
- Indigenous SHS client numbers increased by an average of 7% each year since 2011–12 to around 68,900 in 2018–19, increasing more than the rate of the general SHS population (3% increase on average per year).
- The length of support for Indigenous clients continues to increase, with the median number of days up from 46 in 2016–17 to 49 days in 2018–19; longer than that for non-Indigenous clients (47 days in 2018–19).
- The proportion of Indigenous clients receiving accommodation services remained steady at 41% in 2018–19; and the median length of accommodation decreased (18 nights in 2018–19, down from 20 nights in 2017–18); shorter than non-Indigenous clients (38 nights).
- Around 3,300 more Indigenous clients ended support in public or community housing and 1,200 fewer Indigenous clients were in short-term or emergency accommodation following assistance from SHS agencies in 2018–19.
Client characteristics
Over 241,700 Indigenous clients have been supported by homelessness agencies since the Specialist Homelessness Services Collection (SHSC) began in 2011–12. The number of Indigenous clients has been steadily increasing over this time. The key trends identified from 2016–17 to 2018–19 have been:
- The rate of service use by Indigenous clients has increased from 806.4 clients per 10,000 Indigenous people in 2016–17 to 832.0 in 2018–19 (Table INDIGENOUS.1).
- The gap between the rate of Indigenous and non-Indigenous SHS clients has increased. In 2018–19, Indigenous people were 9.8 times as likely to use specialist homelessness services as non-Indigenous people, up from 9.2 times in 2016–17.
- After taking into account differences in population size, in 2018–19 Indigenous clients accessed services at the highest rate in Inner/outer regional areas, consistent with 2017–18.
- The rate of service use among Indigenous clients living in Remote/very remote areas has increased; from 721 Indigenous clients per 10,000 population in 2016–17 to 795 in 2018–19. The rate of use for non-Indigenous clients in the same area has decreased, from 41 clients per 10,000 in 2016–17 to 37 in 2018–19.
- The length of support for Indigenous clients continues to increase, with the median number of days up from 46 in 2016–17 to 49 days in 2018–19, and is longer than that for non-Indigenous clients (47 days in 2018–19).
|
|
2016–17 Indigenous |
2016–17 Non-Indigenous |
2017–18 Indigenous |
2017–18 Non-Indigenous |
2018–19 Indigenous |
2018–19 Non-Indigenous |
|---|---|---|---|---|---|---|
|
Number of clients |
64,644 |
196,689 | 65,184 | 194,072 | 68,853 | 195,993 |
|
Proportion of all clients where Indigenous status reported |
25 |
75 |
25 |
75 | 26 |
74 |
|
Rate (per 10,000 population) |
806.4 |
88.1 |
802.7 |
85.7 | 832.0 |
84.6 |
|
Rate ratio |
9.2 |
9.4
|
9.8 |
|
||
|
Rate difference (per 10,000 population) |
718.3 |
|
717.0 |
747.4 |
|
|
|
Remoteness rate (per 10,000 population) |
||||||
|
Major cities |
832.4 |
80.7 |
814.7 |
78.1 | 830.1 |
76.9 |
|
Inner/outer regional |
852.3 |
115.3 |
845.3 |
115.3 | 862.2 |
118.7 |
|
Remote/very remote |
720.9 |
40.7 |
711.9 |
38.2 | 794.6 |
37.4 |
|
Rate ratio |
||||||
|
Major cities |
10.3 |
|
10.4 |
10.8 | ||
|
Inner/outer regional |
7.4 |
|
7.3 |
7.3 |
|
|
|
Remote/very remote |
17.7 |
|
18.7 |
21.2 |
|
|
|
Housing situation at the beginning of first support period (proportion (per cent) of all clients) |
||||||
|
Homeless |
47 |
43 |
47 |
43 | 46 |
42 |
|
At risk of homelessness |
53 |
57 |
53 |
57 | 54 |
58 |
|
Length of support (median number of days) |
46 |
39 |
48 |
44 | 49 |
47 |
|
Average number of support periods per client |
1.7 |
1.7 |
1.8 |
1.8 | 1.7 |
1.8 |
|
Proportion receiving accommodation |
42 |
29 |
41 |
28 | 41 |
28 |
|
Median number of nights accommodated |
20 |
41 |
20 |
41 | 18 |
38 |
|
Proportion of a client group with a case management plan |
71 |
61 |
73 |
63 | 72 |
64 |
|
Achievement of all case management goals (per cent) |
20 |
22 |
23 |
22 | 24 |
22 |
Notes
- Rates were directly age-standardised as detailed in the Technical information section. Minor adjustments in rates may occur between publications reflecting revision of the estimated resident population by the Australian Bureau of Statistics.
- Rate ratio is the Indigenous rate divided by the Non-Indigenous rate and is used to compare the 2 service use rates. Rate difference reveals the gap between the 2 rates.
- The denominator for the proportion achieving all case management goals is the number of client groups with a case management plan. Denominator values for proportions are provided in the relevant supplementary table.
- Previous years’ data can be found in the 2017–18 Specialist Homelessness Services Annual report.
- Data for 2016–17 has been adjusted for non-response. Due to improvements in the rates of agency participation and SLK validity, data from 2017–18 are not weighted. The removal of weighting does not constitute a break in time series and weighted data from 2016–17 is comparable with unweighted data for 2017–18 onwards. For further information, please refer to the Technical Notes.
Source: Specialist Homelessness Services Collection 2016–17 to 2018–19.
Age and sex
In 2018–19 (Supplementary table INDIGENOUS.1):
- More than half (53% or 36,400) of Indigenous SHS clients were under the age of 25, compared with 41% (79,600) of non-Indigenous clients.
- The largest age group for Indigenous males was 0–9 years (28% or 7,600), for Indigenous females it was 25–34 (21% or 8,900).
- The proportion of clients over the age of 55 was lower in Indigenous clients (5% or 3,300) compared with non-Indigenous clients (9% or 18,500).
States and territory and remoteness
In 2018–19 (Supplementary table INDIGENOUS.2 and 5):
- Victoria had the highest rate of Indigenous clients (1,717.0 per 10,000 population) and Tasmania the lowest (336.4 per 10,000 population). However, Victoria also had the highest rate of non-Indigenous clients (147.9 per 10,000 population), followed by Tasmania (124.3 per 10,000 population).
- The Northern Territory had the highest proportion of Indigenous clients (85%) and Victoria the lowest (10%).
- The proportion of Indigenous clients seeking services in Major cities (36% or 24,800) was lower than non-Indigenous clients (67% or 131,900).
- A higher proportion of Indigenous clients sought services in Remote (12% or 8,300) and Very remote areas (7% or 4,500), compared with non-Indigenous clients (1% and <1%, respectively).
Selected vulnerabilities
Over half (55% or 29,800) of Indigenous SHS clients aged 10 years and over reported 1 or more vulnerabilities (i.e. family and domestic violence, mental health issues, or problematic drug and/or alcohol use).
In 2018–19 (Table INDIGENOUS.2):
- 1 in 20 (5% or 2,500 clients) Indigenous SHS clients were experiencing all 3 vulnerabilities.
- Almost 1 in 5 (16% or around 8,600) Indigenous clients were experiencing 2 vulnerabilities.
- More than 1 in 3 (35% or around 18,600) Indigenous clients were experiencing 1 vulnerability.
- Less than half (45% or around 24,100) Indigenous clients did not experience any of the selected vulnerabilities.
|
Family and domestic violence |
Mental health issue |
Problematic drug |
Clients |
Per cent |
|---|---|---|---|---|
|
Yes |
Yes |
Yes |
2,490 |
4.6 |
|
Yes |
Yes |
No |
4,874 |
9.1 |
|
Yes |
No |
Yes |
1,338 |
2.5 |
|
No |
Yes |
Yes |
2,431 |
4.5 |
|
Yes |
No |
No |
10,59 |
19.7 |
|
No |
Yes |
No |
6,287 |
11.7 |
|
No |
No |
Yes |
1,738 |
3.2 |
|
No |
No |
No |
24,072 |
44.7 |
|
|
|
|
53,829 |
100.0 |
Notes
- Clients are assigned to one category only based on their vulnerability profile.
- Clients are aged 10 and over.
- Totals may not sum due to rounding.
Source: Specialist Homelessness Services Collection 2018–19.
Service use patterns
Since 2016–17, the number of Indigenous clients seeking assistance from SHS agencies has increased. Key trends identified in this client population are (Table INDIGENOUS.1):
- The median number of days Indigenous clients receive support has increased from 46 days in 2016–17 to 49 days in 2018–19.
- The median number of nights accommodated has decreased, down from 20 nights in 2016–17 to 18 nights in 2018–19.
New or returning clients
In 2018–19 (Supplementary table INDIGENOUS.6):
- There were more returning Indigenous clients (that is, those who had received SHS services at some point since the collection began in 2011–12) than there were new Indigenous clients (63% compared with 37%).
Main reasons for seeking assistance
The three main reasons why Indigenous clients sought assistance from SHS agencies in 2018–19 were (Supplementary table INDIGENOUS.7):
- family and domestic violence (24% or 16,500 clients)
- housing crisis (19% or 12,800 clients)
- inadequate or inappropriate dwelling conditions (13% or almost 8,700 clients)
Services needed and provided
The need for accommodation assistance was broadly similar between Indigenous and non-Indigenous clients, with the exception of short-term or emergency accommodation.
- Half of Indigenous clients (50% or 34,400) needed short-term or emergency accommodation, higher than the proportion of non-Indigenous clients (37% or 72,600). Two-thirds of those Indigenous clients with the need for short-term or emergency accommodation received this support (67%); a higher proportion than non-Indigenous clients (56%).
Other services commonly needed by Indigenous clients during 2018–19 were:
- advice/information (78%) with 98% provided this assistance
- advocacy/liaison (58%) with 97% provided this assistance
- material aid/brokerage (39%) with 88% provided this assistance
Assistance for family and domestic violence was another frequently requested service (27%), with 90% of clients with this need having such assistance provided.
For some general services, needs were higher for Indigenous clients when compared with non-Indigenous clients, including meals (30% compared with 14%), laundry/shower facilities (25% compared with 10%) and transport (31% compared with 18%).
Outcomes at the end of support
Outcomes presented here describe the changes in a client’s housing situation between the start and end of support. Data is limited to clients who ceased receiving support during the financial year—meaning that their support periods had closed and they did not have ongoing support at the end of the year.
Many clients had long periods of support or even multiple support periods during 2018–19. They may have had a number of changes in their housing situation over the course of their support. These changes within the year are not reflected in the data presented here, rather the client situation at the start of their first support period in 2018–19 is compared with the end of their last support period in 2018–19. A proportion of these clients may have sought assistance prior to 2018–19, and may again in the future.
At the end of the reporting period in 2018–19:
- The number of Indigenous clients who were known to be homeless at the start of support reduced when support ended: 1 in 3 clients (35% or almost 15,800) were known to be homeless when support ended, down from 46% (or more than 21,500) at the start of support (Table INDIGENOUS.3).
- The reduction in the proportion of clients who were known to be homeless following support was due to decreases in the proportion of clients rough sleeping or with no shelter or living in improvised dwellings (from 9% to 6%) and in the proportion of clients living in a house, townhouse or flat as a ‘couch surfer’ with no tenure (from 20% to 14%).
- Clients living in public or community housing increased following support; there was an increase in clients living in some form of tenure over the course of support, including an increase in the proportion of clients living in public or community housing from 30% to 38% (or an increase of almost 3,300 clients).
These trends demonstrate that by the end of support, many clients have achieved or progressed towards a more positive housing solution. That is, the proportion of clients ending support known to be housed but at risk of homelessness had increased compared with the start of support, and the proportion who were homeless had decreased.
|
Housing situation |
Beginning of support |
End of |
Beginning of support |
End of |
|---|---|---|---|---|
|
No shelter or improvised/inadequate dwelling
|
4,337 | 2,527 | 9.3 | 5.6 |
| Short term temporary accommodation | 7,993 | 6,786 | 17.1 | 15.0 |
|
House, townhouse or flat - couch surfer or with no tenure |
9,194 |
6,479 |
19.7 |
14.3 |
| Total homeless | 21,524 | 15,792 | 46.1 | 34.9 |
|
Public or community housing - renter or rent free |
14,002 |
17,282 |
30.0 |
38.2 |
|
Private or other housing - renter, rent free or owner |
9,723 |
11,150 |
20.8 |
24.6 |
|
Institutional settings |
1,437 |
1,068 |
3.1 |
2.4 |
|
Total at risk |
25,162 |
29,500 |
53.9 |
65.1 |
| Total clients with known housing situation | 46,686 | 45,292 | 100.0 | 100.0 |
| Not stated/other | 5,376 | 6,770 | ||
|
Total clients |
52,062 |
52,062 |
|
|
Notes
- Percentages have been calculated using total number of clients as the denominator (less not stated/other).
- It is important to note that individual clients beginning support in one housing type need not necessarily be the same individuals ending support in that housing type.
- Not stated/other includes those clients whose housing situation at either the beginning or end of support was unknown.
Source: Specialist Homelessness Services Collection. Supplementary table INDIGENOUS.4.
Housing outcomes for homeless versus at risk clients
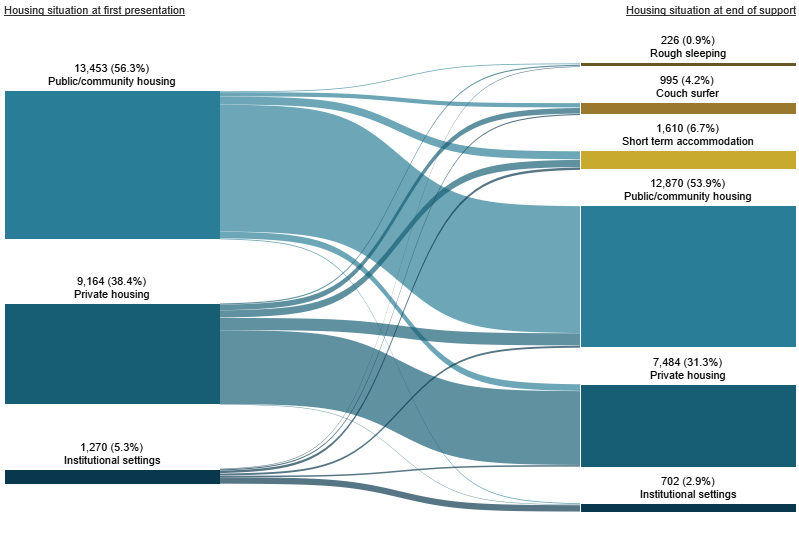
For clients with a known housing status who were at risk of homelessness at the start of support (almost 23,900 clients), by the end of support (Figure INDIGENOUS.1):
- More than half (54% or almost 12,900 clients) were in public or community housing
- Almost one-third (31% or 7,500 clients) were in private housing.
A smaller number were experiencing homelessness at the end of support (2,800 clients or 12% of those who started support at risk of homelessness.
Figure INDIGENOUS.1: Housing situation for clients with closed support who began support at risk of homelessness, 2018–19
Notes
- Excludes clients with unknown housing situation.
- Includes only those clients who ceased receiving support during the financial year (meaning that their support period(s) had closed and they were not in ongoing support at the end of the year).
Source: Specialist Homelessness Services Collection, 2018–19
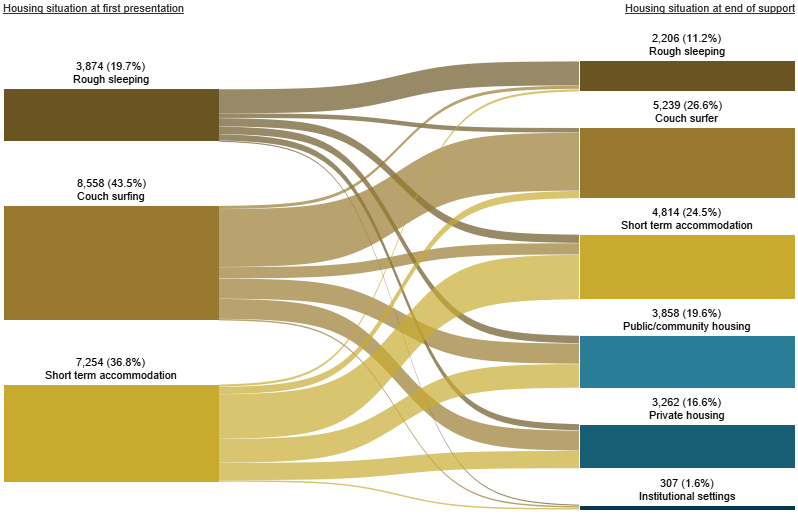
For clients who were known to be homeless at the start of support (almost 19,700 clients), agencies were able to assist (Figure INDIGENOUS.2):
- 4,800 clients (25%) into short term accommodation
- 3,900 (20%) into private or community housing.
A further 5,200 clients (27%) were couch surfing at the end of support.
Figure INDIGENOUS.2: Housing situation for clients with closed support who were experiencing homelessness at the start of support, 2018–19
Notes
- Excludes clients with unknown housing situation.
- Includes only those clients who ceased receiving support during the financial year (meaning that their support period(s) had closed and they were not in ongoing support at the end of the year).
Source: Specialist Homelessness Services Collection, 2018–19
References
ABS (Australian Bureau of Statistics) 2012. Census of population and housing: estimating homelessness, 2011. ABS Cat. no. 2049.0. Canberra: ABS.
ABS 2019. Australian demographic statistics, Mar 2019. ABS Cat. no. 3101.0. Canberra: ABS.
CFFR (Council on Federal Financial Relations) 2018. National Housing and Homelessness Agreement. Viewed 23 January 2019.