Older clients
Home ownership rates for older Australians have decreased from 84% in 1995–96 to 81% in 2017–18 (ABS 2019). This largely reflects a drop in rates of home ownership of older people without a mortgage, decreasing from 77% in 1995–96 to 58% in 2017–18. An increase in home ownership with a mortgage offset much of this change, more than tripling from 7% in 1995–96 to 23% in 2017–18 (ABS 2019).
Older Australians are a national priority homelessness cohort in the National Housing and Homelessness Agreement (CFFR 2018) (see Policy section for more information) recognising the severe impact homelessness may have on older Australians. The number and proportion of Australians who are aged 55 and over have been increasing over recent decades, and are expected to continue to grow (AIHW 2018). During 2018–19, people aged 55 and over comprised 8% (24,200 clients) of all Specialist Homelessness Services (SHS) clients. Specialist homelessness service use by this group is increasing with the number of clients up 36% since 2014–15.
The experiences of older people accessing SHS for assistance have been further investigated in a recent AIHW report. For the purposes of the Specialist Homelessness Services Collection (SHSC), older people are defined as clients aged 55 years and over. For further information, see Technical notes.
Key findings
- In 2018–19, there were about 24,200 people aged 55 years or older receiving homelessness services.
- The majority of older clients presented to SHS as lone persons (61%), and the proportion was higher for males (69%) than for females (53%).
- 2 in 3 older clients presented housed but at risk of homelessness (67%).
- More than half (53%) of older clients were returning clients, that is they had previously been assisted by a SHS agency at some point since the collection began in 2011–12.
- Housing outcomes improved; fewer older clients were known to be homeless at the end of support (down from 34% at the start of support to 25%).
- The proportion of ‘rough sleepers’ decreased from 11% at the beginning of support to 7% at the end of support in 2018–19.
- Most older clients known to be at risk of homelessness at the start of support were assisted to maintain a housing tenancy (94%).
Client characteristics
In 2018–19 (Table OLDER.1):
- SHS agencies assisted almost 24,200 clients aged 55 and over. Since 2014–15, the number of clients aged 55 and over has risen 36% from 17,800 clients.
- Older clients represented 8% of all SHS clients, which has been relatively stable since 2014–15.
|
|
2014-15 |
2015–16 |
2016–17 |
2017–18 | 2018-19 |
|---|---|---|---|---|---|
|
Number of clients |
17,788 |
20,579 |
22,443 |
24,094 | 24,169 |
|
Proportion of all clients |
7 |
7 |
8 |
8 | 8 |
|
Rate (per 10,000 population) |
7.6 |
8.6 |
9.3 |
9.8 | 9.7 |
|
Housing situation at the beginning of the first support period (proportion (per cent) of all clients) |
|||||
|
Homeless |
33 |
34 |
35 |
33 | 33 |
|
At risk of homelessness |
67 |
66 |
65 |
67 | 67 |
|
Length of support (median number of days) |
24 |
25 |
27 |
28 | 31 |
|
Average number of support periods per client |
1.5 |
1.5 |
1.5 |
1.6 | 1.6 |
|
Proportion receiving accommodation |
19 |
18 |
17 |
16 | 17 |
|
Median number of nights accommodated |
31 |
31 |
30 |
29 | 22 |
|
Proportion of a client group with a case management plan |
48 |
50 |
51 |
52 | 53 |
|
Achievement of all case management goals (per cent) |
31 |
27 |
26 |
27 | 27 |
Notes:
- Rates are crude rates based on the Australian estimated resident population (ERP) at 30 June of the reference year. Minor adjustments in rates may occur between publications reflecting revision of the estimated resident population by the Australian Bureau of Statistics.
- The denominator for the proportion receiving accommodation is all older clients. Denominator values for proportions are provided in the relevant supplementary table.
- The denominator for the proportion achieving all case management goals is the number of client groups with a case management plan. Denominator values for proportions are provided in the relevant supplementary table.
- Data for 2014–15 to 2016–17 have been adjusted for non-response. Due to improvements in the rates of agency participation and SLK validity, data from 2017–18 are not weighted. The removal of weighting does not constitute a break in time series and weighted data from 2014–15 to 2016–17 are comparable with unweighted data for 2017–18 onwards. For further information, please refer to the Technical Notes.
Source: Specialist Homelessness Services Collection 2014–15 to 2018–19.
Age and sex
Of the almost 24,200 older clients who received SHS support during 2018–19:
- Almost 2 in 3 (65%) were aged 55–64; the remaining one-third were 65 or over.
- More than half (55%) were female.
Indigenous status
The proportion of clients 55 and over was lower for Indigenous clients (5% or 3,300) compared with non-Indigenous clients (9% or 18,500).
States and territories and remoteness area
In 2018–19:
- Victoria recorded the highest number of older SHS clients (more than 11,300), representing almost half (47%) of this client group in Australia (Supplementary table OLDER.2), followed by New South Wales with 5,400 clients (22%).
- While recording one of the lowest counts (over 700 or 3% of national total) of older clients in Australia, the Northern Territory had the highest rate of clients, at 30 per 10,000 estimated resident population.
- 3 in 5 older clients (61%) sought assistance in Major cities, 34% in Inner and Outer Regional areas, and 5% in Remote and Very Remote areas.
Labour force
- In 2018–19, the majority of older clients were not in the labour force (57%), over a third were unemployed (36%) and less than 1 in 10 (7%) were employed.
- Of those who were in the labour force, females were more likely to be employed full-time (3%) and part-time (6%) than males (2% and 3%, respectively) (Figure OLDER.1).
Figure OLDER.1: Older clients, by labour force status and sex, 2018–19
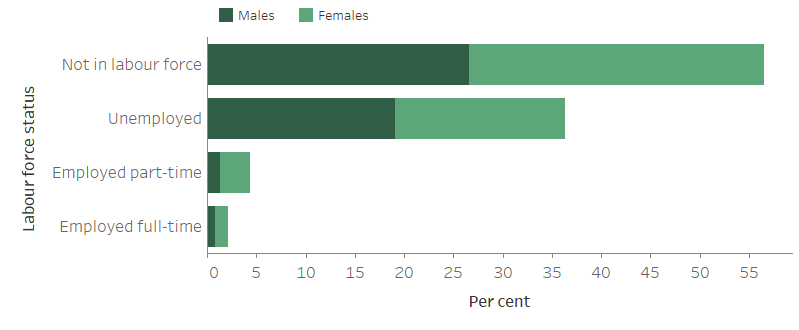
Notes:
- Per cent calculations based on total clients less 'Not stated'.
- The labour force status at the beginning of support for clients 55 years and over.
- Labour force status 'Employed don't know' not shown.
Source: Specialist Homelessness Services Collection 2018–19, Supplementary table OLDER.11.
Living arrangements
In 2018–19, of the almost 21,900 clients who stated their living arrangement upon presentation to a SHS agency (Supplementary table OLDER.9):
- 6 in 10 (61% or 13,200 clients) were living alone, higher for males than females (69% compared with 53%)
- more than 1 in 10 (13% or 2,800 clients) were living as a lone parent or couple with children
- almost 2,600 people (12%) were living with other family which can include a person with or without children living (as a couch surfing arrangement) with others.
Selected vulnerabilities
The majority of older clients (54% or 13,000) reported no vulnerabilities (defined as a current mental health issue, experiencing family and domestic violence, or problematic drug and/or alcohol use) (Table OLDER.2).
- 1 in 5 older clients (20% or almost 4,800 clients) reported a current mental health issue only
- 1 in 7 older clients (15% or 3,500 clients) reported family and domestic violence only.
|
Family and domestic violence |
Mental health issue |
Problematic drug |
Clients |
Per cent |
|---|---|---|---|---|
|
Yes |
Yes |
Yes |
207 |
0.9 |
|
Yes |
Yes |
No |
1,421 |
5.9 |
|
Yes |
No |
Yes |
100 |
0.4 |
|
No |
Yes |
Yes |
722 |
3.0 |
|
Yes |
No |
No |
3,493 |
14.5 |
|
No |
Yes |
No |
4,774 |
19.8 |
|
No |
No |
Yes |
458 |
1.9 |
|
No |
No |
No |
12,994 |
53.8 |
|
|
|
|
24,169 |
100.0 |
Notes:
- Clients are assigned to one category only based on their vulnerability profile.
- Clients are aged 55 and over.
- Totals may not sum due to rounding.
Source: Specialist Homelessness Services Collection 2018–19.
Service use patterns
Since 2014–15, the number of older clients seeking assistance from SHS agencies increased at a greater rate than other age groups. Key trends identified in this client population over the 5 years to 2018–19 are (Table OLDER.1):
- The rate of older clients increased from 8 per 10,000 in 2014–15 to 10 in 2018–19.
- The median number of days older clients received support increased from 24 days in 2014–15 to 31 days in 2018–19.
- The proportion receiving any accommodation fell from 19% in 2014–15 to 17% in 2018–19. In addition, the median number of nights accommodated decreased, down from 31 nights in 2014–15 to 22 nights in 2018–19.
New or returning clients
More than half (53% or 12,700) were returning clients, having previously been assisted by a SHS agency at some point since the collection began in 2011–12. Returning clients were more likely to be aged 55–64 (69% compared with 60% of new clients).
Main reasons for seeking assistance
The 3 main reasons why older clients sought assistance from SHS agencies in 2018–19 were (Supplementary table OLDER.5):
- housing crisis (21% or 4,900 clients)
- financial difficulties (18% or 4,300)
- family and domestic violence (17% or 4,000).
The main reason for older clients seeking assistance was different for those experiencing homelessness compared with those presenting to services at risk of homelessness (Supplementary table OLDER.6).
- For those experiencing homelessness the main reasons for seeking assistance were:
- housing crisis (28% or 2,000 clients)
- inadequate or inappropriate dwelling conditions (22% or 1,600)
- financial difficulties (10% or 700).
- For those at risk of homelessness:
- financial difficulties (20% or 3,000 clients)
- housing crisis (19% or 2,800)
- family and domestic violence (18% or 2,700).
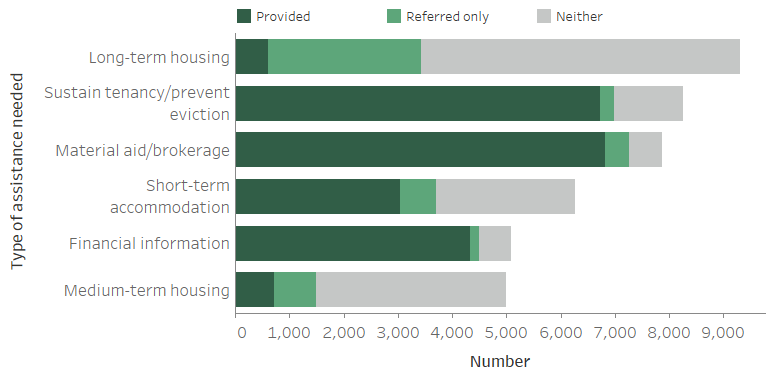
Services needed and provided
In 2018–19, half (50% or 12,000) of older SHS clients needed accommodation, of those 34% were provided assistance. Demand was highest for long-term accommodation (39% or 9,300 needed long-term accommodation) compared with medium-term (21% or 5,000) and short-term or emergency accommodation (26% or 6,300). Of the older clients that needed long-term housing, less than 1 in 10 (7%) were provided assistance (Figure OLDER.2).
Other services most commonly needed by older clients during 2018–19 were:
- assistance to sustain tenancy or prevent tenancy failure or eviction (34%), with 81% provided this assistance
- material aid/brokerage (33%), with 87% provided this assistance
- financial information (21% or 5,100), with 85% provided with assistance.
Table OLDER.2: Older clients, by selected vulnerability characteristics, 2018–19
Notes:
- Excludes ‘Other basic assistance’, ‘Advice/information’ and ‘Advocacy/liaison on behalf of client’.
- Short-term accommodation includes temporary and emergency accommodation and sustain tenancy/prevent eviction includes assistance to sustain tenancy or prevent tenancy failure or eviction.
- 'Neither' indicates a service was neither provided nor referred.
Source: Specialist Homelessness Services Collection 2018–19, Supplementary table OLDER.3.
Outcomes at the end of support
Outcomes presented here describe the change in clients’ housing situation between the start and end of support. Data is limited to clients who ceased receiving support during the financial year—meaning that their support periods had closed and they did not have ongoing support at the end of the year.
Many clients had long periods of support or even multiple support periods during 2018–19. They may have had a number of changes in their housing situation over the course of their support. These changes within the year are not reflected in the data presented here, rather the client situation at the start of their first support period in 2018–19 is compared with the end of their last support period in 2018–19. A proportion of these clients may have sought assistance prior to 2018–19, and may again in the future.
At the end of the reporting period in 2018–19 (Table OLDER.3).
- The number of clients who were known to be homeless at the start of support reduced when support ended: 1 in 4 (25% or almost 4,100) were known to be homeless when support ended, down from 34% at the start of support.
- The reduction in the proportion of clients who were known to be homeless following support was due to decreases in the proportion of clients rough sleeping or with no shelter or living in improvised dwellings (from 11% to 7%) and in the proportion of clients living in a house, townhouse or flat as a ‘couch surfer’, with no tenure (from 11% to 8%).
Clients living in public or community housing increased following support; there was an increase in clients living in some form of tenure over the course of support, including an increase in the proportion of clients living in public or community housing from 21% to 28% (or more than 4,600 clients).
|
Housing situation |
Beginning of support |
End of |
Beginning of support |
End of |
|---|---|---|---|---|
|
No shelter or improvised/inadequate dwelling
|
1,882 | 1,082 | 11.4 | 6.6 |
| Short term temporary accommodation | 1,826 | 1,679 | 11.0 | 10.2 |
|
House, townhouse or flat - couch surfer or with no tenure |
1,837 |
1,294 |
11.1 |
7.9 |
| Total homeless | 5,545 | 4,055 | 33.5 | 24.7 |
|
Public or community housing - renter or rent free |
3,407 |
4,649 |
20.6 |
28.3 |
|
Private or other housing - renter, rent free or owner |
6,984 |
7,151 |
42.2 |
43.6 |
|
Institutional settings |
596 |
545 |
3.6 |
3.3 |
|
Total at risk |
10,987 |
12,345 |
66.5 |
75.3 |
| Total clients with known housing situation | 16,532 | 16,400 | 100.0 | 100.0 |
| Not stated/other | 2,928 | 3,060 | ||
|
Total clients |
19,460 |
19,460 |
|
|
Notes:
- Percentages have been calculated using total number of clients as the denominator (less not stated/other).
- It is important to note that individual clients beginning support in one housing type need not necessarily be the same individuals ending support in that housing type.
- Not stated/other includes those clients whose housing situation at either the beginning or end of support was unknown.
Source: Specialist Homelessness Services Collection. Supplementary table OLDER.4.
Housing outcomes for homeless versus at risk clients
For clients with a known housing status who were at risk of homelessness at the start of support (almost 10,700 clients), by the end of support (Figure OLDER.3):
- Most clients (6,100 clients or 57%) were in private or other housing
- Around 3,600 clients (34%) were in public or community housing.
Around 600 clients were experiencing homelessness at the end of support (6% of those who started support at risk).
Figure OLDER.3: Housing situation for clients with closed support who began support at risk of homelessness, 2018–19
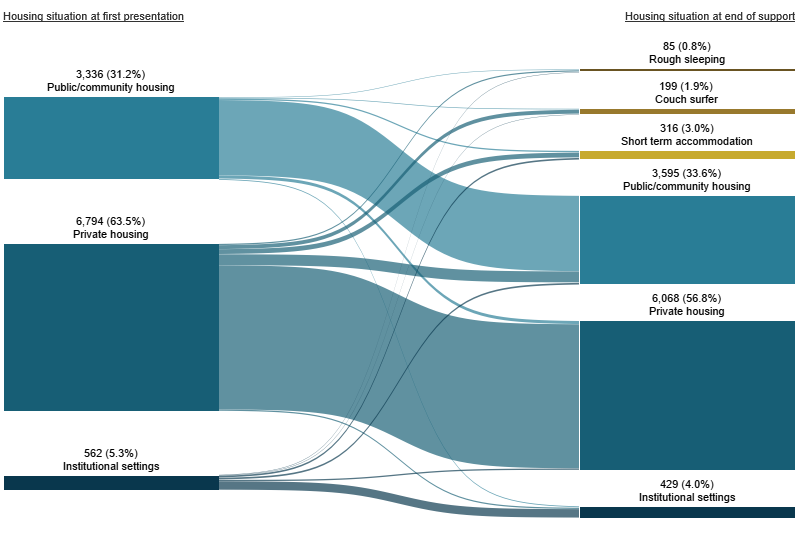
Notes:
- Excludes client with unknown housing situation.
- Includes only those clients who ceased receiving support during the financial year (meaning their support period(s) had closed and they were not in ongoing support at the end of the year).
Source: Specialist Homelessness Services Collection, 2018–19
For clients who were known to be homeless at the start of support (just over 5,200 clients) (Figure OLDER.4):
- 1,300 clients (25%) were in short term accommodation at the end of support
- 900 (18%) were in private or other housing at the end of support.
One in five clients (almost 1,100 or 20%) were couch surfing at the end of support.
Figure OLDER.4: Housing situation for clients with closed support who were experiencing homelessness at the start of support, 2018–19
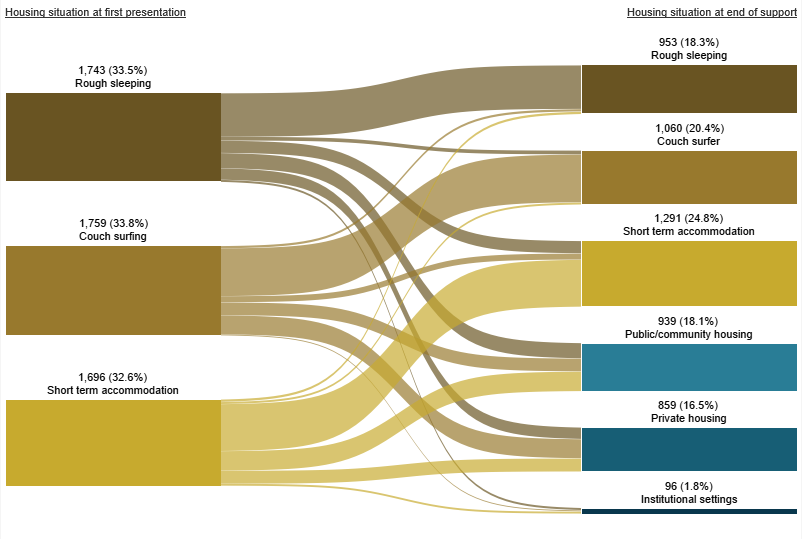
Notes:
- Excludes client with unknown housing situation.
- Includes only those clients who ceased receiving support during the financial year (meaning their support period(s) had closed and they were not in ongoing support at the end of the year).
Source: Specialist Homelessness Services Collection, 2018–19
References
ABS (Australian Bureau of Statistics) 2019. Housing Occupancy and Costs, Australia, 2017–18. ABS Cat. no. 4130.0. Canberra: ABS.
AIHW (Australian Institute of Health and Welfare) 2018. Older Australia at a glance. Cat. No: AGE 87. Canberra: AIHW.
CFFR (Council on Federal Financial Relations) 2018 National Housing and Homelessness Agreement. Viewed 23 January 2019,