Client geography
The rate at which people access Specialist Homelessness Services (SHS) can vary geographically partly due to service accessibility and region-specific factors such as housing availability and affordability. In Australia, market changes can influence the availability of housing options within an area (Wood et al. 2014). Over time, research has shown shifts towards higher concentrations of Australia’s homelessness occurring in urban settings while more remote areas continue to be characterised by higher rates of homelessness (Parkinson et al. 2019). This section provides an overview of the geography of clients supported by SHS agencies across Australia based on the client’s location prior to receiving SHS support.
Key findings
- In 2018–19, the median rate of people accessing SHS services across Statistical Area 4 regions was 100.1 clients per 10,000 population.
- The highest rate of clients were in Northern Territory - Outback (567.1 clients per 10,000 population or 5,600 clients).
- The rate of clients in Western Australia - Outback (North) had the largest increase from 343.2 per 10,000 population in 2017–18 to 468.0 in 2018–19.
- While females made up the majority of SHS clients across Australia (60% or 173,600 clients) in 2018–19, male clients made up just over half of clients in Australia’s state capitals.
Identifying client location in the Specialist Homelessness Services Collection (SHSC)
This section examines people seeking SHS support based on where the person lived in the week before presenting to a SHS agency, as reported at the first support period during 2018–19. Clients are assigned to only one region for the financial year but may move to other regions before subsequent support periods. This location may not be a permanent address, for example, people who were couch surfing the week prior to seeking services may nominate the location of their temporary accommodation. Client location is classified to Statistical Area 4 (SA4) based on the 2016 Australian Statistical Geography Standard (ASGS) (ABS 2016). A total of 88 SA4s are reported in this section, which excludes non-geographic codes and Other Territories. Please note that other geographic analysis in the report is based on agency location. See Technical information for more details.
Geographic profile of SHS clients
In 2018–19, SHS agencies assisted over 290,300 clients across Australia, up from 288,800 in 2017–18. Taking population into consideration, the rate of people receiving SHS services varied by region in 2018–19 (Supplementary table CLIENTLOC.1):
- The median rate of clients receiving SHS support across SA4 regions was 100.1 per 10,000 population, up from 97.4 in 2017–18.
- The highest rate of SHS clients were in Northern Territory – Outback (567.1 per 10,000 population), higher than the Northern Territory and national rates (390.0 and 116.2 respectively):
- The highest number of clients were in Melbourne – West (Victoria) (15,500 clients or 188.7 per 10,000 population).
- Areas with the top 5 highest client rates had, on average, 376.6 SHS clients per 10,000 population (Table CLIENTLOC.1).
- Compared to 2017–18, 46 SA4 regions had an increase in SHS client rates while the remaining 42 SA4s had a decrease (Table CLIENTLOC.1):
- The largest increase in the rate of SHS clients was in Western Australia – Outback (North) from 343.2 per 10,000 population in 2017–18 to 468.0 in 2018–19. Of these clients, where housing situation was known:
- More than 4 in 5 (84% or 3,800 clients) were at risk of homelessness while just over 1 in 10 (15% or 700 clients) were homeless.
- The largest decrease in the rate of SHS clients was in Geelong (Victoria) from; 179.5 per 10,000 population in 2017–18 decreasing to 151.3 in 2018–19.
- The largest increase in the rate of SHS clients was in Western Australia – Outback (North) from 343.2 per 10,000 population in 2017–18 to 468.0 in 2018–19. Of these clients, where housing situation was known:
|
State |
SA4 |
Client: |
Client: number |
Change in rate from 2017–18 to 2018–19 (per cent) |
|||||
|---|---|---|---|---|---|---|---|---|---|
| Highest rate (per 10,000 ERP) | |||||||||
|
Northern Territory |
Northern Territory —Outback |
567.1 |
5,601 |
0.6 |
|||||
|
Western Australia |
Western Australia —Outback (North) |
468.0 |
4,571 |
36.4 |
|||||
|
Victoria |
North West |
305.6 |
4.649 |
-2.5 |
|||||
| Victoria | Latrobe —Gippsland | 280.8 | 7,947 | 6.0 | |||||
| South Australia | South Australia —Outback | 261.4 | 2,216 | 5.0 | |||||
|
Lowest (rate per 10,000 ERP) |
|
|
|
|
|||||
|
Queensland |
Sunshine Coast |
21.9 |
820 |
-10.7 |
|||||
|
New South Wales |
Sydney—North Sydney and Hornsby |
20.2 |
882 |
1.7 |
|||||
| Queensland | Brisbane West | 19.3 | 369 | 11.5 | |||||
| New South Wales | Sydney—Ryde | 18.1 | 361 | -15.4 | |||||
| New South Wales | Sydney—Baulkham Hills and Hawkesbury | 15.2 | 374 | -10.5 | |||||
Notes:
- Client location based on location the week before first presentation, as reported at the first support period to an SHS agency in 2018–19.
- Rates are crude rates based on the Australian estimated resident population (ERP) at 30 June of the reference year.
Source: Specialist Homelessness Services Collection 2018–19, Supplementary table CLIENTLOC.1.
Figure CLIENTLOC.1: Change in SHS clients per 10,000 population (per cent), by Statistical Area 4 (SA4), 2017–18 to 2018–19

Notes:
- Clients are assigned to a region based on where they lived in the week before presenting to a SHS agency in 2018–19. Clients are assigned to one region, based on the location details provided in the first support period in the reference year. Regions are defined by the 2016 Australian Statistical Geography Standard (ASGS).
- Rates are crude rates based on the Australian estimated resident population at 30 June of the reference year.
- Mapped SA4s (88) exclude Other Territories and non-geographic SA4s coded as No usual address, Migratory, Offshore or Shipping.
Source: Specialist Homelessness Services Collection 2017–18, Supplementary table CLIENTLOC.1: Specialist Homelessness Services Collection 2018–19, Supplementary table CLIENTLOC.1.
Housing situation
Among clients whose housing status was known at the beginning of their first support period in 2018–19, around 112,000 clients presented homeless and 153,700 presented at risk of homelessness to SHS agencies across Australia (Supplementary table CLIENTS.1).
The proportion of homeless and at risk clients varied by geographic region:
- Clients presenting at risk of homelessness to an SHS agency made up the majority (more than 50% of clients where housing situation known) of clients in 61 SA4 regions while clients presenting homeless made up the majority in the remaining 27 SA4s.
- The highest proportion of homeless clients were in Perth - Inner (73% or 1,200 clients) in Western Australia’s capital region while the highest proportion of at risk clients were in Western Australia - Outback (North) (84% or 3,800 clients).
Client characteristics
The age of clients seeking SHS assistance varied by geography across Australia in 2018–19 (Figure CLIENTLOC.2):
- Almost 1 in 3 clients (32%) presenting to SHS services from Ipswich (Queensland) were aged 0–9 years, higher than the state (Qld, 22%) and national proportion (17%).
- Highest proportion of clients aged between 10–24 years were in Sydney - Baulkham Hills and Hawkesbury (47%) and Sydney - Sutherland (49%) (New South Wales) while the highest proportion of older clients aged 65 and over were in Melbourne - North West (Victoria) (6%).
Figure CLIENTLOC.2: Proportion of clients seeking services, by age group, by selected Statistical Area 4 (SA4) regions, 2018–19
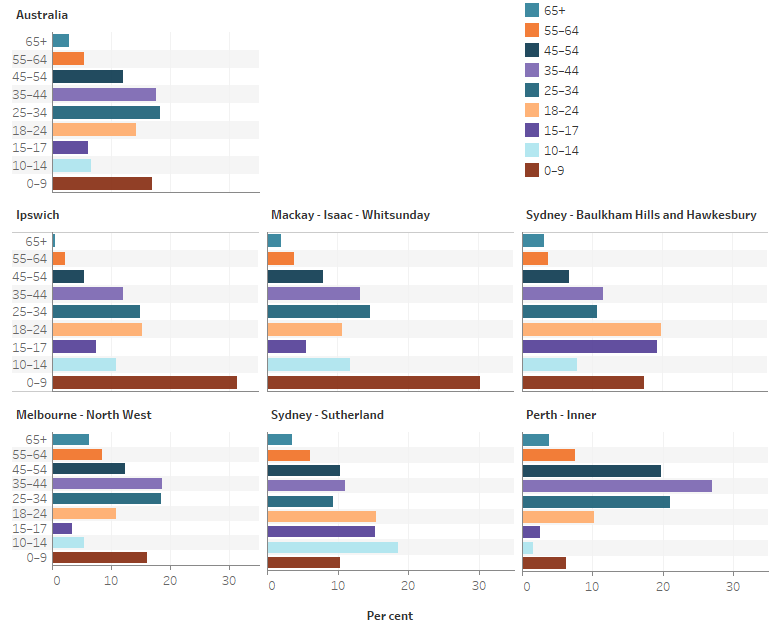
Note: Clients are assigned to a region based on where they lived in the week before presenting to a SHS agency in 2018–19. Clients are assigned to one region, based on the location details provided in the first support period in the reference year. Regions are defined by the 2016 Australian Statistical Geography Standard (ASGS).
Source: Specialist Homelessness Services Collection 2018–19, Supplementary table CLIENTS.1 and CLIENTLOC.1.
Of the 290,300 clients presenting to SHS agencies across Australia, females made up the majority of clients in 2018–19 (60% or around 173,600 clients: Supplementary table CLIENTS.1). The location of male and female clients the week before presenting to a SHS agency varied (Figure CLIENTLOC.3):
- The highest proportion of female clients receiving services were in Bunbury (Western Australia) and Moreton Bay - South (Queensland); 74% and 71% respectively.
- Male clients made up the majority of clients in more urban areas of state capital cities with Perth - Inner region (56%) with the highest proportion of males.
Figure CLIENTLOC.3: Proportion of clients receiving SHS services, by sex, by Statistical Area 4 (SA4), 2018–19
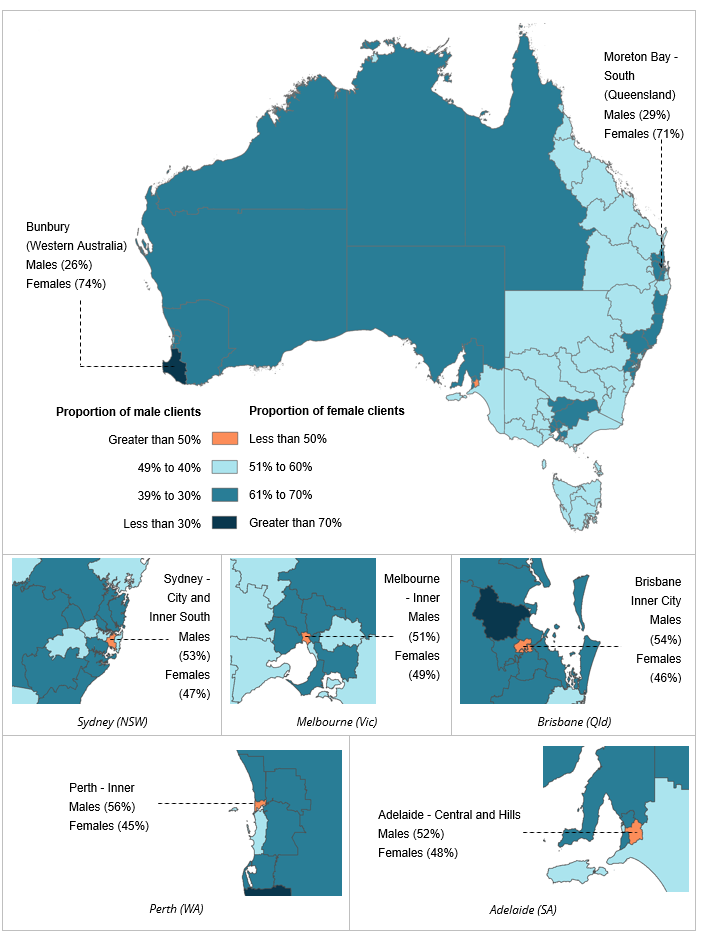
Notes:
- Per cent calculations based on total clients excluding clients from ‘Other territories’ and those that have not provided address information. Proportions may not add to 100% due to rounding.
- Clients are assigned to a region based on where they lived in the week before presenting to a SHS agency in 2018–19. Clients are assigned to only one region, based on the location details provided in the first support period in the reference year. Regions are defined by the 2016 Australian Statistical Geography Standard (ASGS).
- Mapped SA4s (88) exclude Other Territories and non-geographic SA4s coded as No usual address, Migratory, Offshore or Shipping.
Source: Specialist Homelessness Services Collection 2018–19, Supplementary table CLIENTLOC.1.
References
ABS (Australian Bureau of Statistics) 2016. Australian Statistical Geography Standard (ASGS): Volume 1—Main Structure and Greater Capital City Statistical Areas, July 2016. ABS cat. no. 1270.0.55.001. Canberra: ABS.
Parkinson S, Batterham D, Reynolds M & Wood G 2019. The changing geography of homelessness: a spatial analysis from 2001 to 2016, AHURI Final Report 313. Melbourne: Australian Housing and Urban Research Institute. Available from:
Wood G, Batterham D, Cigdem M & Mallett S 2014. The spatial dynamics of homelessness in Australia 2001–11, AHURI Final Report No.227. Melbourne: Australian Housing and Urban Research Institute. Available from: