States and territories and peer group
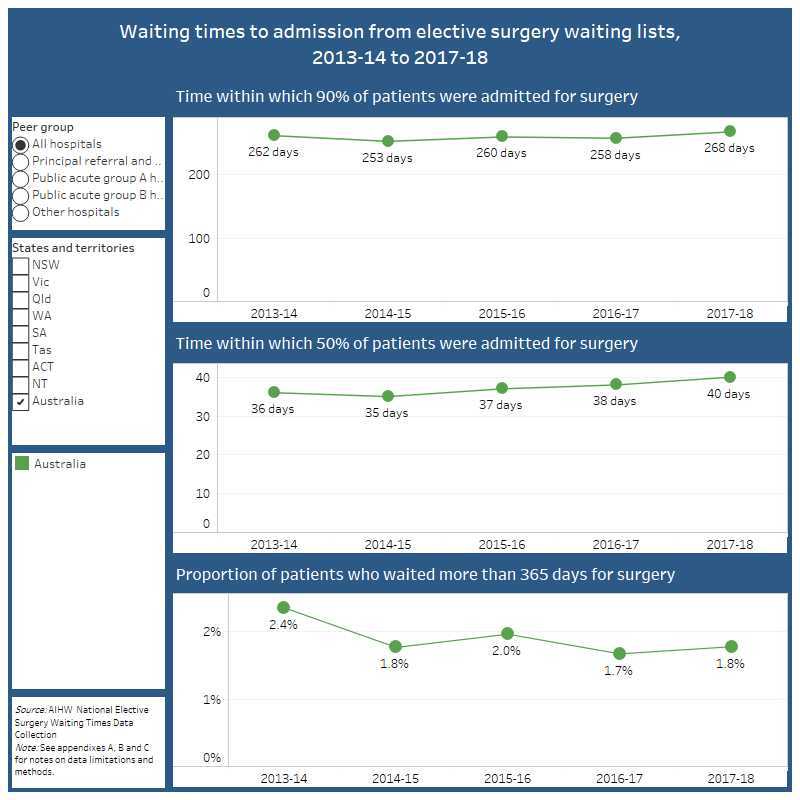
Data visualisation of waiting times to admission from elective surgery waiting lists, 2013-14 to 2017-18.

For caveat information for these data see table 4.1, 4.2, 4.3 and S4.1. Available to download from the Data section of this report.
Waiting time for 50% of patients
The waiting time for 50% indicates the time within which half of all patients were admitted for the awaited procedure. Half of the patients had a shorter waiting time, and half had a longer waiting time.
Between 2013–14 and 2017–18, the time within which 50% of patients were admitted for the awaited procedure:
- increased for all public hospital peer groups.
- generally decreased for Victoria, (from 35 days to 29 days) and the Northern Territory (from 36 to 23 days)
- increased for New South Wales (from 49 to 55 days), Queensland (from 28 to 40 days), Western Australia (from 29 to 39 days), South Australia (from 35 to 42 days) and the Australian Capital territory (from 48 to 54 days)
- increased for Tasmania between 2013–14 and 2015–16, and then decreased to 42 days in 2017–18.
Waiting time for 90% of patients
The 90th percentile waiting time indicates the amount of time within which 90% of patients were admitted for the awaited procedure. For the remaining 10% of patients, the wait was longer.
Between 2013–14 and 2017–18, the time within which 90% of patients were admitted for the awaited procedure:
- overall fluctuated around 260 days, increasing to 268 days in 2017–18
- decreased in Victoria, from 222 days in 2013–14 to 150 days in 2017–18
- increased for Queensland, Western Australia, South Australia and the Australian Capital Territory
- increased between 2013–14 and 2015–16 in Tasmania and the Northern Territory, then decreased to 238 and 160 days, respectively in 2017–18
Patients who waited more than 365 days
Patients who wait more than a year for their surgery can be regarded as not having their surgery ‘on time’.
Between 2013–14 and 2017–18, the proportion of patients who waited more than 365 days to be admitted:
- decreased nationally from 2.4% to 1.8%
- decreased in Public group A and Public group B hospitals and fluctuated in Principal referral and Women’s and children’s hospitals.
Waiting times in 2017–18
In 2017–18, the time within which 50% of patients were admitted for the awaited procedure was 40 days—compared with 36 days in 2013–14.
The the time within which 50% of patients were admitted from waiting lists for Principal referral and women’s and children’s hospitals (35 days) was shorter than for Public acute group A hospitals and Public acute group B hospitals (43 days and 49 days, respectively).
Principal referral and Women’s and children’s hospitals had the shortest time within which 90% of patients were admitted for the awaited procedure (237 days). The proportion of patients who waited more than 365 days was lowest in Public group B hospitals (0.9%).
Where to go for more information
Information on admissions by surgical specialty and intended surgical procedure is available in Waiting list activity.
Information on waiting times by urgency category is available in the PDF report available for download.
Tables 4.11 to 4.18: Selected statistics for admissions from public hospital elective surgery waiting lists, by clinical urgency category (for each state and territory). Available to download in the data section of this report.
Information on data limitations and methods is available in Appendix A and Appendix B.


