Measures
The report presents data on two headline measures of the relative efficiency of Australia’s largest public hospitals focusing on acute admitted patients:
- Cost per National Weighted Activity Unit (NWAU), including total NWAU
- Comparable Cost of Care, including total units of activity.
The report also presents information for 16 selected conditions and procedures using cost per admission and length of stay measures.
What is an admission?
The APC NMDS records information about a patient’s admission in hospital, termed ‘episode of admitted patient care’.
An ‘episode of care’ is defined as ‘the period of admitted patient care between a formal or statistical admission, and a formal or statistical separation, characterised by only one care type’.2 For example, it defines the period between the patient’s arrival and when the patient is discharged or moved to a ward for subacute care, such as rehabilitation.
The ‘episode of care’ records information about the patient’s characteristics, including their age and sex, information about the care they received in hospital such as diagnosis and any procedures they underwent during their admission, and when they arrived and left hospital.
Each ‘episode of care’ is allocated to an AR-DRG group, allowing us to understand the mix and complexity of patients across a hospital. This provides the basis for deriving how many units of activity were performed at a hospital during the financial year, a measure that represents the number of admissions, adjusted for the complexity of patients who were admitted to the hospital and their individual patient characteristics which lead to higher costs.
For the purposes of this report an ‘episode of admitted patient care’ is referred to as an ‘admission’, which is synonymous with a ‘separation’. A weighted separation is referred to as a ‘unit of activity’.
What is Cost per NWAU?
Cost per NWAU, developed by the Independent Hospital Pricing Authority (IHPA), measures the cost of patients whose treatment was eligible for funding under the National Health Reform Agreement against a common unit of activity termed NWAU. The NWAU is a point of relative pricing that the Commonwealth uses to determine its contribution to public hospitals through Activity Based Funding (ABF).
Each NWAU is weighted for clinical complexity, and individual patient characteristics that lead to higher costs. Where a patient meets the criteria, an adjustment is applied to the price weight for Cost per NWAU in recognition of the additional costs incurred in delivering public hospital services to these patients. Examples of patients who are eligible for adjustments include psychiatric patients, remote and regional patients, and those who are recorded as being of Aboriginal and Torres Strait Islander origin.
The ‘average’ hospital service is funded by one NWAU. More intensive and expensive activities are funded by multiples of NWAUs, and simpler and less expensive activities are funded by fractions of an NWAU.
There are four funding streams:
- Emergency department (ED)
- Acute admitted
- Subacute
- Non-admitted.
This report compares the Cost per NWAU for acute admitted patients; it does not include ED costs associated with each patient’s admission.
The Cost per NWAU measure excludes patients whose services are not eligible for Commonwealth funding under ABF, such as patients funded by the Department of Veterans’ Affairs (DVA), private sources (self-funded, privately insured) or motor vehicle accident insurance.
The Authority used this measure to compare 84 major and large public hospitals against their peers, based on the size and location of the hospital. In particular, Cost per NWAU was calculated for:
- 46 major metropolitan hospitals
- 13 large metropolitan hospitals
- 25 major regional hospitals.
For more information on Cost per NWAU see the National Efficient Price Determination 2014–15.3
What is Comparable Cost of Care?
Comparable Cost of Care is a national measure developed by the Authority to compare the relative efficiency of Australia’s largest public hospitals, and to report against the COAG- agreed indicator ‘Cost per weighted separation and total case weighted separations’.
In developing the measure, the Authority has built on the substantial work undertaken by IHPA in its development of the NWAU.
The measure considers:
- The costs incurred by a hospital, for acute admitted patients irrespective of whether patients’ treatment was eligible for funding under the National Health Reform Agreement, for example patients funded by the DVA or private sources
- The costs where the accounting practices are similar across hospitals, taking into account the costs from arrival at the hospital until the patient is discharged, transferred to another hospital, transferred to subacute care (for example palliative care, rehabilitation) or dies
- The casemix of admitted patients. In addition adjustments were made for the complexity of patients and individual patient characteristics that lead to higher costs (see Units of activity)
- The costs associated with the journey of all acute patients from the time of arrival at the hospital until departure. For patients who entered the hospital through the ED, the costs incurred during the ED have been added to the costs incurred during the patient’s admission.
The Authority has considered the cost of care in emergency departments for acute admitted patients, as its previous report Hospital Performance: Time patients spent in emergency departments in 2011–12 found significant variation between hospitals in the length of time admitted patients stayed in EDs prior to their admission.4
The measure does not consider the quality of services delivered, patient outcomes, the costs of capital, or where costs are not comparable due to variation in either accounting or operational practices between hospitals.
The Authority has used Comparable Cost of Care to compare 82 major and large public hospitals with their peers, based on the size and location of the hospital.
This information is provided for:
- 47 major metropolitan hospitals
- 12 large metropolitan hospitals
- 23 major regional hospitals.
What is cost per admission?
Cost per admission is a measure developed by the Authority that uses the same costs as Comparable Cost of Care, capturing the costs of a patient’s journey from arrival at the hospital until the patient is either discharged or admitted to a non-acute care ward. The report provides the average cost per admission for Australia’s major metropolitan and major regional public hospitals for 16 selected conditions or procedures.
The average cost per admission for a condition or procedure for a peer group is calculated by tallying the total comparable cost for all hospitals within the peer groups that are included in the report (i.e. had a Comparable Cost of Care result calculated), divided by the total number of separations for those hospitals.
The range of the average cost per admission for a peer group was calculated by deriving the average cost per admission for a condition or procedure at each hospital in the major peer groups, and taking the lowest and highest hospital’s average cost per admission.
The average cost per condition or procedure in major metropolitan and major regional hospitals, by length of stay, is derived by calculating the average cost of treating a patient who stayed for a specific number of days. The maximum value of length of stay in days depicted on the average cost per admission by length of stay graphs, has been derived to represent up to 90% of all separations for that condition or procedure.
Why has length of stay been included?
Research has shown that length of stay is an important driver of hospital costs.5 The Authority’s analyses indicate that the relationship between length of stay and costs is more closely related for medical conditions as compared to surgical procedures, for those conditions included in the report.
Accordingly, the report provides information on the cost of admissions for patients who stayed varying lengths of time as acute admitted patients for 16 common conditions and procedures.
The conditions and procedures selected replicate those reported in the Authority’s report Hospital Performance: Length of stay in public hospitals in 2011–12. These conditions and procedures were chosen based on AR-DRG Version 6.0x using the following criteria:
- Relevance to the clinical community
- Number of hospitals able to report without suppression for small number of admissions
- Balance in the number of surgical compared to medical DRGs
- Distribution of length of stay
- Percentage of admissions for acute care
- Percentage of transfers to other hospitals
- Percentage of care type changes.
Further details on the AR-DRG v6.0x codes for the 16 selected procedures and conditions, and length of stay methodology can be found in Hospital Performance: Length of stay in public hospitals in 2011–12, Technical Supplement.5
Rationale for using AR-DRG version 6.0x
In 2011–12, the data prepared by hospitals and submitted to the NHCDC by state and territory governments used AR-DRG v6.0x.
While AR-DRG v7.0 is a more recent version and considered the best reflection of clinical practice, analysis of the specific AR-DRGs (conditions and procedures) highlighted a material change (approximately a 10% difference) in the allocation of separations between AR-DRGs using AR-DRG v7.0 and v6.0x.
The three AR-DRGs included in this report that are affected are heart failure with and without complications or comorbidities (F62A, F62B) and vaginal delivery without complications or comorbidities (O60B). For AR-DRG v6.0x vaginal deliveries (O60B), only 22% of separations were in common with AR-DRG v7.0.
To increase the value of information provided to clinicians and system managers, and to remain consistent with information published by the Authority in Hospital Performance: Length of stay in public hospitals in 2011–12, AR-DRG v6.0x was used to derive Comparable Cost of Care, rather than AR-DRG v7.0.
Hospital overall results using AR-DRG v6.0x and v7.0 are highly correlated (R2 value: 0.999).
Differences between the main measures
A summary of the main similarities and differences between Cost per NWAU and Comparable Cost of Care can be found in Table 1.
The Authority undertook a comparison of Comparable Cost of Care and Cost per NWAU across A1.1, A1.2, B1 and B2 hospitals, the outcome of the analysis was a high correlation between the measures (R2value: 0.94) (Figure 1).
At a hospital level, the most noticeable difference between the two measures is the inclusion of ED costs associated with an admission in the Comparable Cost of Care measure.
For some hospitals, the second most noticeable difference between Comparable Cost of Care and Cost per NWAU is the inclusion of DVA and compensable patients in the Comparable Cost of Care measure. The inclusion of these patients resulted in a material change to the results for some hospitals. This can be attributed to the proportion of DVA and compensable patients that are admitted, and the difference between the average cost of DVA and compensable patients, compared to the average cost of other acute admitted patients.
Results for hospitals included in the report did not significantly change between the measures Comparable Cost of Care and Cost per NWAU, when private patient revenues were not excluded from Cost per NWAU. However, it is still appropriate for the Comparable Cost of Care measure to include all private patient costs and not discount the activity.
The results show there are hospitals that have lower and higher costs per weighted separation using both methods.
Figure 1: Distribution of the relative efficiency of major metropolitan, large metropolitan and major regional public hospitals using Comparable Cost of Care and Cost per NWAU, 2011–12
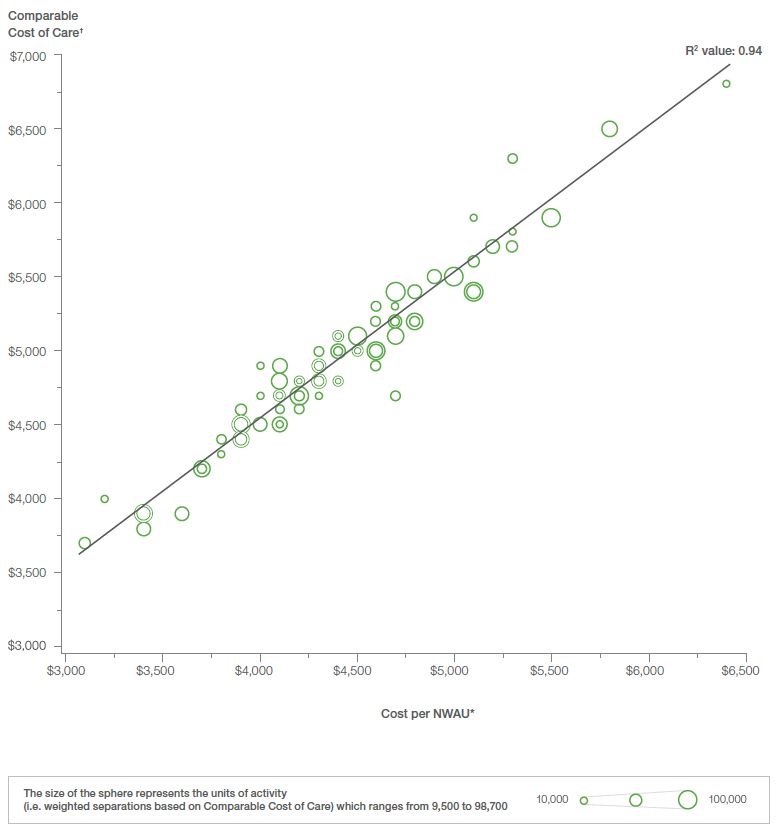
Notes:
* The NWAU has been calculated using the National Efficient Price Determination 2014–15.
† The line of best fit has been calculated using all hospital results where Cost per NWAU and Comparable Cost of Care are available. Results for hospitals with less than eight hospitals in a peer group for both measures are not shown on the graph.
Source: National Health Performance Authority analysis of results calculated using the National Hospital Cost Data Collection 2011–12 and Admitted Patient Care National Minimum Dataset 2011–12.
Table 1: Differences between the measures of Cost per NWAU and Comparable Cost of Care
Cost per NWAU
Cost per National Weighted Activity Unit (NWAU) is a measure of the average cost of a unit of activity provided to acute admitted patients in a public hospital.
Comparable Cost of Care
Comparable Cost of Care is a measure that focuses on the comparable costs of acute admitted patients and includes the costs of emergency department patients who are subsequently admitted to allow for an assessment of the relative efficiency of public hospitals.
|
Cost per NWAU |
Comparable Cost |
|
|---|---|---|
| Comparable costs | ||
| Allied health; Imaging; Pharmacy; Pathology | ✔ | ✔ |
| Critical care | ✔ | ✔ |
| Hotel goods and services* | ✔ | ✔ |
| Non-clinical and on-costs | ✔ | ✔ |
| Operating room | ✔ | ✔ |
| Prostheses | ✔ | ✔ |
| Specialised procedure suite | ✔ | ✔ |
| Ward medical, nursing and supplies | ✔ | ✔ |
| ED costs | x | ✔ |
| Blood costs | x | x |
| Teaching, training & research (direct) | x | x |
| Depreciation | x | x |
| Excluded costs* | x | x |
| Payroll tax | x | x |
| Medications subsidised by Commonwealth programmes (e.g. PBS) | x | x |
| Property, plant and equipment | x | x |
| Patients included | ||
|
Public patients |
✔ | ✔ |
|
Private patients† |
✔ | ✔ |
|
Admitted in 2011–12 and discharged in 2011–12 |
✔ | ✔ |
|
Compensable patients |
x | ✔ |
|
Department of Veterans’ Affairs |
x | ✔ |
| Adjustments for legitimate cost variations | ||
|
Specialist paediatric; Specialist psychiatric age; Indigenous; Remoteness area; Intensive care unit; Radiotherapy |
✔ | ✔ |
Notes:
* As defined by the Australian Hospital Patient Costing Standards (AHPCS), version 2.0.
† NWAUs are discounted to account for private patient revenues.