Overview
Every day, decisions are made in hospitals, or by governments, that influence how efficiently hospitals run. In 2014–15, the running costs of public hospitals ($48 billion) continued to represent the largest proportion of the $161.6 billion that was spent on health by all governments, insurers and consumers.
This report examines Australia’s largest public hospitals and the amount of money each of those hospitals spent in 2014–15 to provide a notional ‘average’ hospital service to their acute admitted patients – the group that accounts for the largest proportion of hospital costs nationally. This group includes patients who are admitted for the management of childbirth, surgery, or other diagnostic and therapeutic procedures. These results were calculated by comparing a hospital’s running costs to a measure of output known as a National Weighted Activity Unit (NWAU).
The report also examines changes in these ‘average’ service costs across three financial years. Data for more than 25 major public hospitals are reported, with data for more than 100 public hospitals available to explore in the accompanying interactive web tool.
The report finds:
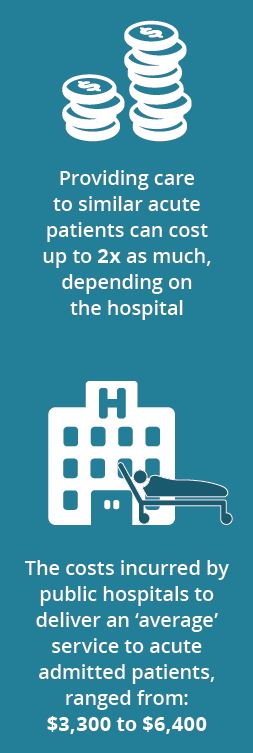
- In 2014–15, the cost of providing an average service could be almost twice as high at one hospital ($6,400) compared to another ($3,300).
- From 2012–13 to 2014–15, seven major public hospitals decreased their cost for providing a notional ‘average’ service by at least 5%. Westmead Hospital in NSW decreased their cost by 9% over this period. Both Flinders in SA and Prince Charles in QLD decreased their cost by 8% over this period.
- One major public hospital increased their costs per notional ‘average’ service by 10%, the Royal Perth Hospital in WA.