Primary care – avoidable hospital admissions
This section presents data for the primary care indicators supplied by Australia to the OECD collection. It compares these data with the HCQO results for OECD countries and comments on the comparability of the data provided to the OECD specification (OECD 2021).
The OECD HCQOs for primary care include rates of avoidable hospital admissions for a range of conditions. Rates of avoidable hospital admissions serve as measures of the effectiveness of the primary health care system, as access to a high-performing primary care system can decrease acute deterioration and hospital admissions among people with the examined conditions (OECD 2021).
The OECD published all primary care indicators in OECD.Stat and a selection of primary care indicators in Health at a glance 2023. Australia calculated and submitted 6 of the 7 primary care indicators requested:
- Asthma hospital admission rates
- Chronic obstructive pulmonary disease (COPD) hospital admission rates
- Congestive heart failure (CHF) hospital admission rates
- Hypertension hospital admission rates
- Diabetes hospital admission rates
- Diabetes lower extremity amputation rates.
See: Primary care indicator definitions.
Overall data comparability and methods
The most recent data supplied by Australia for the acute care indicators was for 2020.These data are recorded as 2020 data in the OECD.Stat database, and so are described in that way here. Data from other OECD countries published on OECD.Stat for 2020 are used for comparison and calculation of OECD averages in this section. These data were extracted from the OECD.Stat database in January 2024, and may not reflect subsequent updates made to the database.
The OECD requested primary care data for adults aged 15 and over only, disaggregated by age and sex. The OECD then calculated age-sex standardised rates (standardised to the equivalent 2015 OECD population) for these indicators based on the supplied data. The indicators are presented on the same basis here.
Health at a glance 2023 notes that disease prevalence and availability of hospital care, differences in coding practices, and differences in hospital data coverage may affect the comparability of the data (OECD 2023). To prevent double counting, countries were asked to exclude the transfer of patients between hospitals from the calculations for primary care indicators.
The counting unit in the NHMD is the hospital separation which indicates the end of an episode of admitted patient care. Hence, Australia’s separation data are used in the calculation of hospital admission rates. Diagnosis and procedure codes are assigned after separation, when all information regarding the episode of care is available. This enables for more accurate capture of information.
Asthma hospital admission rate
Asthma is a common chronic condition that affects the airways (the breathing passage that carries air into our lungs). People with asthma experience episodes of wheezing, shortness of breath, coughing, chest tightness and fatigue due to widespread narrowing of the airways (NACA 2022).
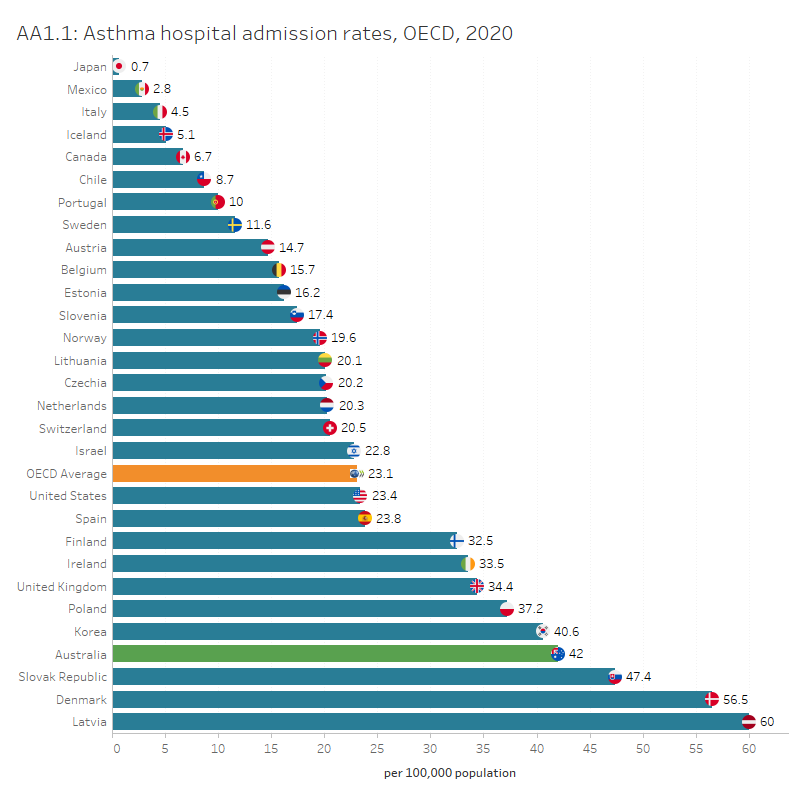
In Australia, the asthma hospital admission rate reported for people aged 15 and over was 42 asthma hospital admissions per 100,000 population in 2020, higher than the OECD average of 23 asthma hospital admissions per 100,000 population. Among the countries that submitted data for this indicator, Japan reported the lowest rate with 0.7 per 100,000 population.
In Australia, the asthma hospital admission rate reported for people aged 15 and over decreased from 71 per 100,000 population in 2011. The rate for females was higher than that for males (58 and 24 per 100,000 population, respectively).
Interactive AA1.1 below compares OECD countries that submitted data for 2020 for this indicator, while AA1.2 presents Australia’s 10-year trend for this indicator where data are available.
Figures AA1.1 and AA1.2
AA1.1 presents OECD countries with data published for asthma hospital admission rate in 2020, which shows Australia had a higher rate than the OECD average. AA1.2 presents Australia’s 10-year trend for this indicator, which shows an overall decrease from 2011.
Refer to the Data tables for more information.
Chronic obstructive pulmonary disease hospital admission rate
Chronic obstructive pulmonary disease (COPD) is a preventable and treatable lung disease characterised by chronic obstruction of lung airflow that interferes with normal breathing and is not fully reversible.
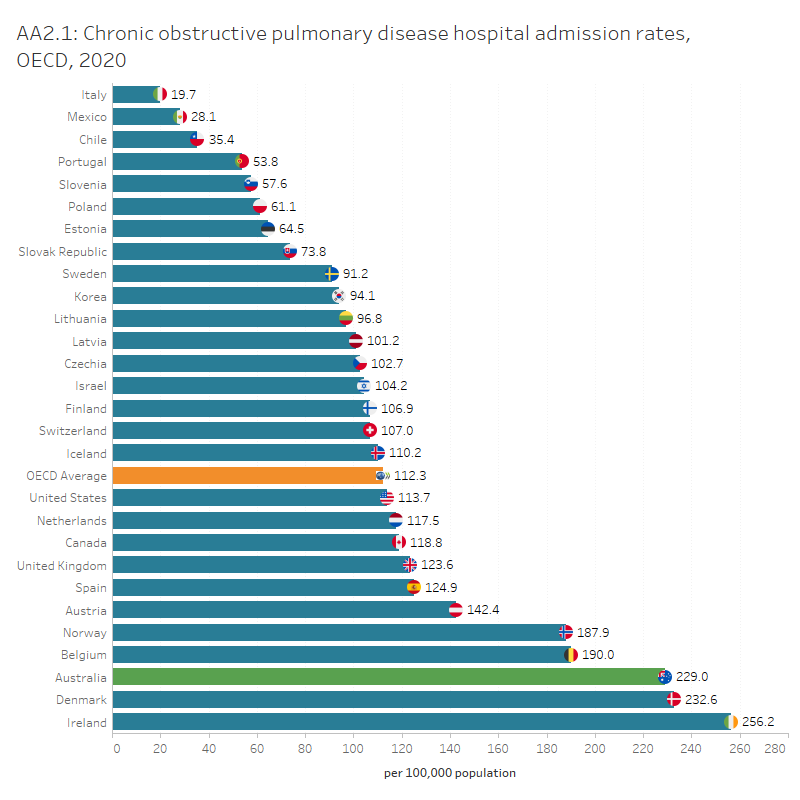
In Australia, the COPD hospital admission rate reported for people aged 15 and over was 229 per 100,000 population in 2020, higher than the OECD average of 112 per 100,000 population. Among the OECD countries that submitted data for this indicator, Italy had the lowest rate with 20 per 100,000 population.
In Australia, the COPD hospital admission rate reported for people aged 15 and over has decreased from 340 per 100,000 population in 2011. The rate was higher for males than females (242 and 224 per 100,000 population, respectively) – a gap which has narrowed over the past decade.
Interactive AA2.1 below compares OECD countries that submitted data for 2020 for this indicator, while AA2.2 presents Australia’s 10-year trend for this indicator where data are available.
Figures AA2.1 and AA2.2
AA2.1 presents OECD countries with data published for COPD hospital admission rate in 2020, which shows Australia had a higher rate than the OECD average. AA2.2 presents Australia’s 10-year trend for this indicator, which shows an overall decrease from 2011.
Refer to the Data tables for more information.
Congestive heart failure hospital admission rate
CHF is a chronic condition in which the pumping power of the heart muscle is weakened.
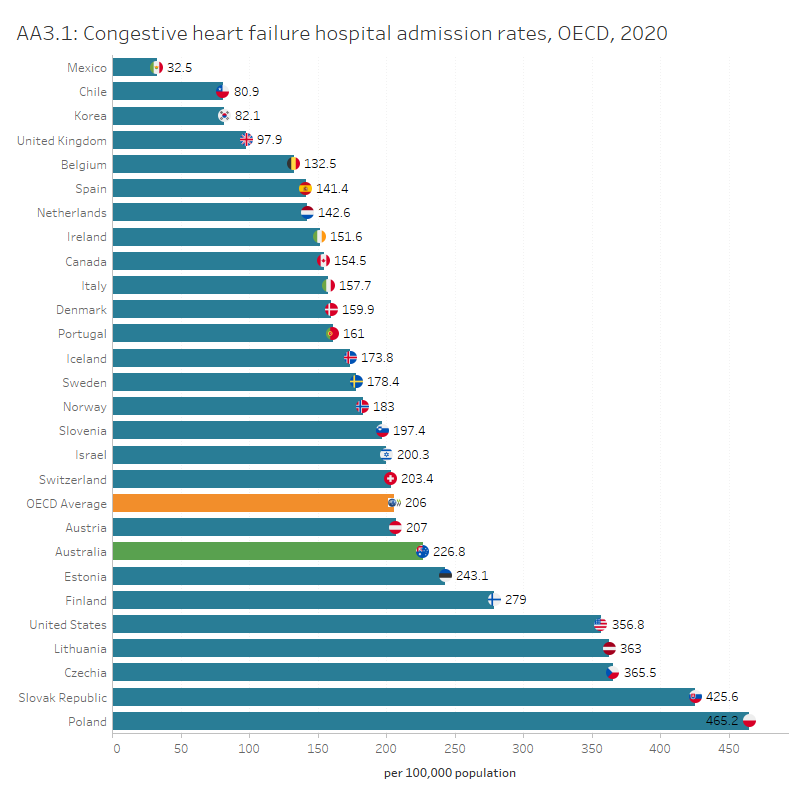
In Australia, the CHF hospital admission rate reported for people aged 15 and over was 227 per 100,000 population in 2020, higher than the OECD average of 206 per 100,000 population. Among the OECD countries that submitted data for this indicator, Mexico had the lowest rate with 32.5 per 100,000 population.
In Australia, the CHF hospital admission rate reported for people aged 15 and over has fluctuated over the past decade, with the highest rate being 244.5 per 100,000 population in 2016. The rate was higher for males than females (273 and 195 per 100,000 population, respectively).
Interactive AA3.1 below compares OECD countries that submitted data for 2020 for this indicator, while AA3.2 presents Australia’s 10-year trend for this indicator where data are available.
Figures AA3.1 and AA3.2
AA3.1 presents OECD countries with data published for CHF hospital admission rate in 2020, which shows Australia had a lower rate than the OECD average. AA3.2 presents Australia’s 10-year trend for this indicator, which shows a fluctuating trend over time.
Refer to the Data tables for more information.
Hypertension hospital admission rate
Hypertension, also known as high blood pressure, is a major risk factor for chronic conditions such as coronary heart disease and chronic kidney disease.
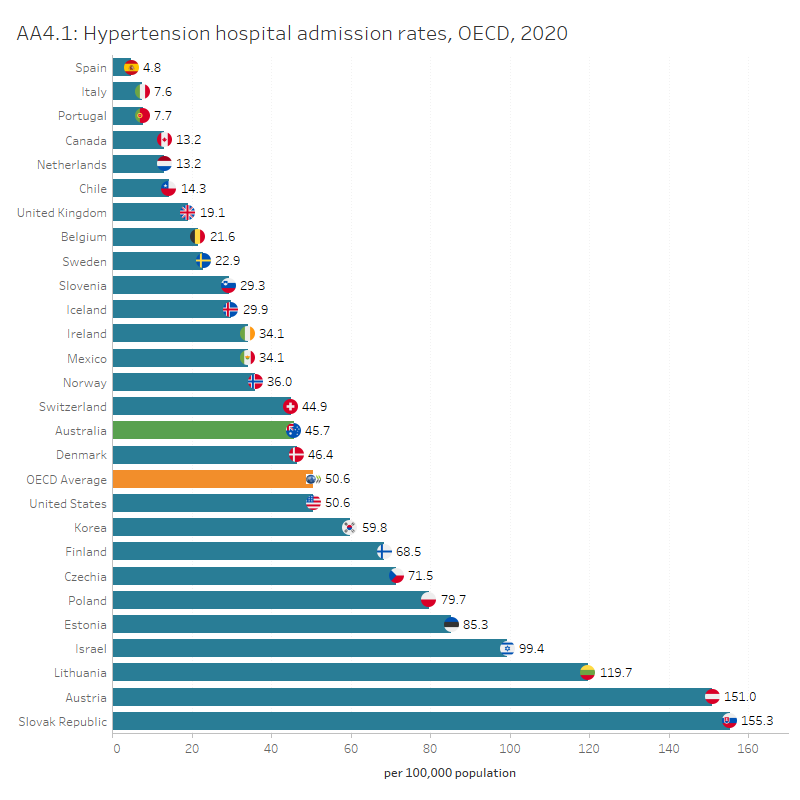
In Australia, the hypertension hospital admission rate reported for people aged 15 and over was 46 per 100,000 population in 2020, higher than the OECD average of 51 per 100,000 population. Among the OECD countries that submitted data for this indicator, Spain and Italy had the lowest rates (4.8 and 7.6 per 100,000 population, respectively).
In Australia, the hypertension hospital admission rate reported for people aged 15 and over has increased from 38 per 100,000 population in 2011. The rate for females was higher than that for males (55 and 31 per 100,000 population, respectively).
Interactive AA4.1 below compares OECD countries that submitted data for 2020 for this indicator, while AA4.2 presents Australia’s 10-year trend for this indicator where data are available.
Figures AA4.1 and AA4.2
AA4.1 presents OECD countries with data published for hypertension hospital admission rate in 2020, which shows Australia had a lower rate than the OECD average. AA4.2 presents Australia’s 10-year trend for this indicator, which shows an overall increase over time.
Refer to the Data tables for more information.
Diabetes hospital admission rate
Diabetes is a chronic condition marked by high levels of glucose in the blood. Effective management of diabetes aims to maintain healthy blood glucose levels to prevent both short- and long-term complications, such as heart disease, kidney disease, blindness, and lower limb amputation.
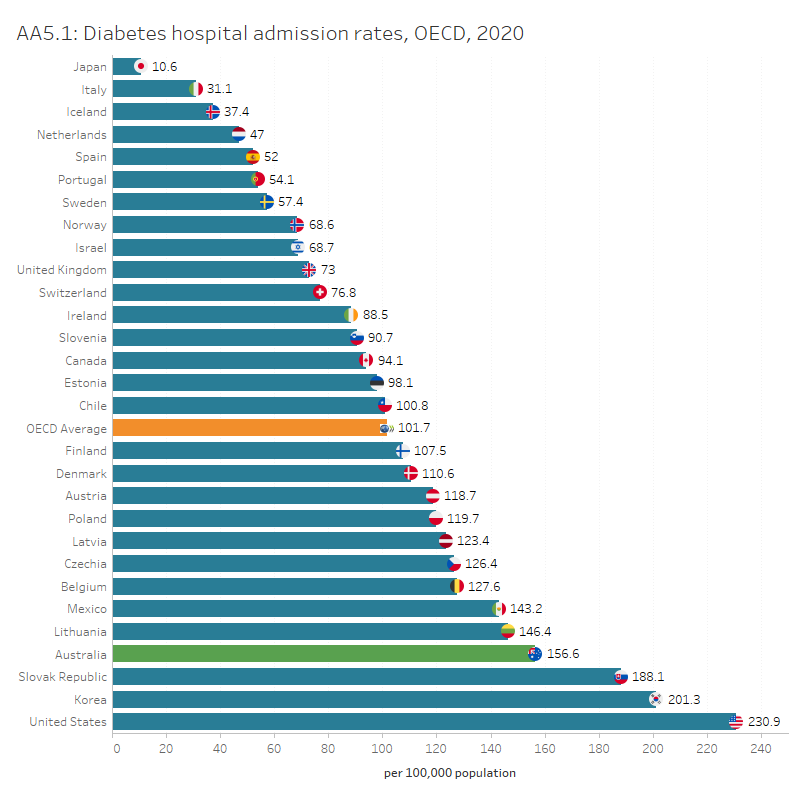
In Australia, the diabetes hospital admission rate reported for people aged 15 and over was 157 per 100,000 population in 2020, higher than the OECD average of 102 per 100,000 population. Among the OECD countries that submitted data for this indicator, Japan had the lowest rate with 11 per 100,000 population.
In Australia, the diabetes hospital admission rate reported for people aged 15 and over has increased from 137 per 100,000 population in 2011. The rate for males was higher than that for females (207 admissions and 116 admissions per 100,000 population, respectively).
It should be noted that changes to the Australian Coding Standards between 2009 and 2013 have affected the comparability of data reported over time for diabetes (NCCH 2008, NCCH 2010, NCCH 2013). The AIHW also recommends that some caution should be taken when comparing data from before and after 2012 due to further changes in the coding standards relating to diabetes from 1 July 2012.
Interactive AA5.1 below compares OECD countries that submitted data for 2020 for this indicator, while AA5.2 presents Australia’s 10-year trend for this indicator where data are available.
Figures AA5.1 and AA5.2
AA5.1 presents OECD countries with data published for diabetes hospital admission rate in 2020, which shows Australia had a higher rate than the OECD average. AA5.2 presents Australia’s 10-year trend for this indicator, which shows a gradual increase since 2013.
Refer to the Data tables for more information.
Diabetes lower extremity amputation rate
Individuals with diabetes have a higher risk of lower limb amputation than people without diabetes (Narres et al. 2017).
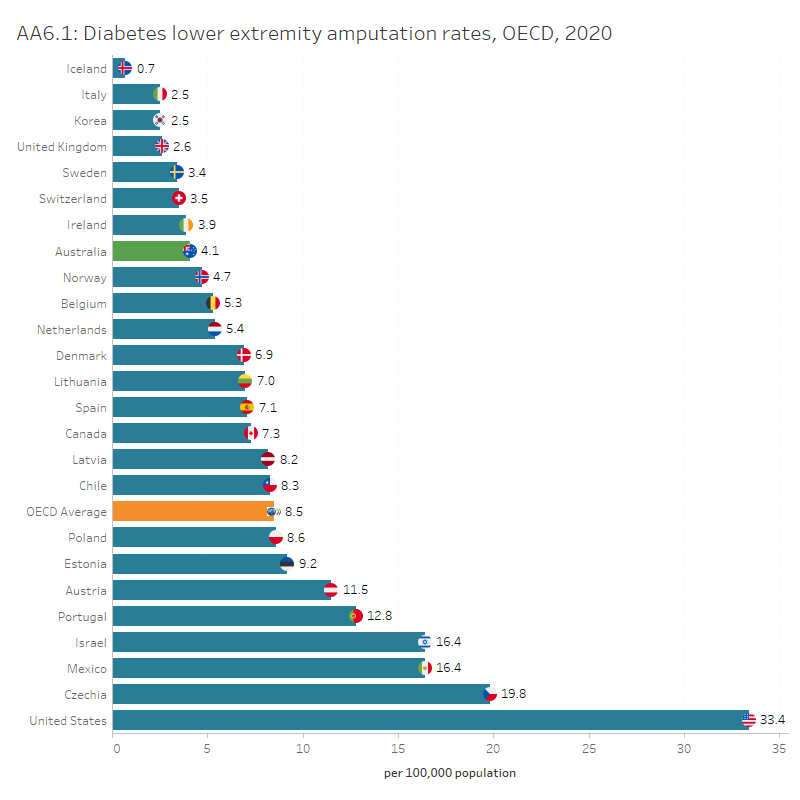
In Australia, the rate for diabetes-related lower extremity amputation was 4.1 per 100,000 population in 2020, lower than the OECD average of 8.5 per 100,000 population. Among the OECD countries that submitted data for this indicator, Iceland, Italy, and Korea had the lowest rates (0.7, 2.5 and 2.5 per 100,000 population, respectively).
In Australia, the rate for diabetes-related lower extremity amputation has remained relatively stable since 2015. The rate for males was more than 3 times higher than that for females (6.8 and 2.0 per 100,000 population, respectively).
As outlined in the Diabetes hospital admission section, caution should be taken when comparing diabetes data because of changes to the Australian Coding Standards, which affected the recording of data relating to diabetes.
Interactive AA6.1 below compares OECD countries that submitted data for 2020 for this indicator, while AA6.2 presents Australia’s 10-year trend for this indicator where data are available.
Figures AA6.1 and AA6.2
AA6.1 presents OECD countries with data published for diabetes lower extremity amputation rate in 2020, which shows Australia had a lower rate than the OECD average. AA6.2 presents Australia’s 10-year trend for this indicator, which shows a stable trend since 2015.
Refer to the Data tables for more information.
NACA (2022) Australian Asthma Handbook, Version 2.2. Melbourne: National Asthma Council Australia, accessed 6 October 2023.
Narres M, Kvitkina T, Claessen H et al. 2017. Incidence of lower extremity amputation in the diabetic compared with the non-diabetic population: a systematic review. PLoS One 12(8): e0182081.
National Centre for Classification in Health (NCCH) 2008. Australian Coding Standards for ICD-10-AM and ACHI, sixth edition. Sydney: NCCH.
NCCH 2010. Australian Coding Standards for ICD-10-AM and ACHI, seventh edition. Sydney: NCCH.
NCCH 2013. Australian Coding Standards for ICD-10-AM and ACHI, eighth edition. Sydney: NCCH.
OECD 2021. Health at a glance 2021: OECD indicators. Paris: OECD.
OECD 2023. Health at a glance 2023: OECD indicators. Paris: OECD.


