Health service use and expenditure in the last year of life
The total estimated cost of the 4 health services examined (hospital admissions, ED presentations, MBS services, and prescriptions supplied under the PBS/RPBS between 1 July 2010 and 31 December 2016) was $296.1 billion, an average of $45.6 billion per year. Of this, 8% ($23.6 billion; average of $3.6 billion per year) was spent on services for people in the last year of life. The expenditure estimates in this report differ from those published in the AIHW’s Health Expenditure Australia reports (AIHW 2021b) because of differences in scope of services and costs included. For more information see ‘Health services and costs excluded from the analysis’ under Study background.
Nearly all Australians use health services in their last year of life
Among the 1.14 million people who died over the study period, 97% (1.1 million) used at least one of the 4 health services in their last year of life. This proportion was similar for males (97%) and females (98%) but slightly less for people aged 0–64 (91%).
The visualisations in this section explore health service use and costs by sex, age, health service type, and whether people were in their last year of life.
Health service use and costs increase until age 70
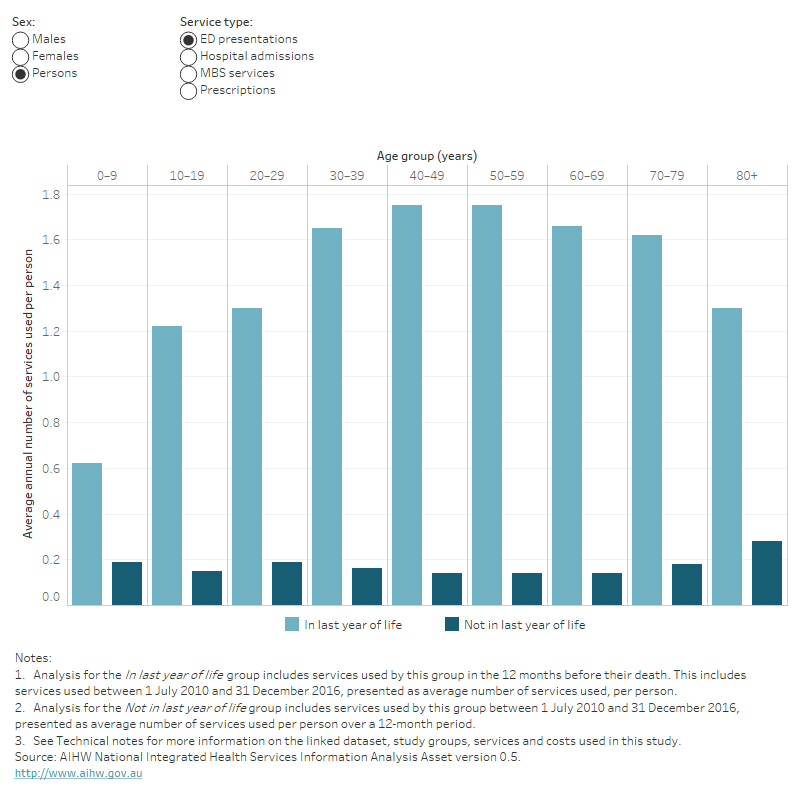
For each health service type, the average annual number of services used and associated costs for people in their last year of life generally increased with age until age 70, after which they fell. For example:
- average annual use of MBS services increased from 22 services per person at age 0–9 to 84 services at age 60–69, before falling to 54 services for people aged 80 and over (Figure 1a).
- average annual costs per person for the 4 health services combined generally increased from $21,000 at age 0–9 to $37,100 at age 60–69. They then fell to $17,000 for people aged 80 and over (Figure 1b).
The fall in service use and costs in the older age groups coincides with when people most often enter residential aged care (AIHW 2021a). Given that costs of health-care services in residential aged care were not included in this study, health service costs for older people are likely to be underestimated.
Among people not in the last year of life, average annual service use increased steadily with age for each service type. However, in each age group, average annual service use per person was higher among people in their last year of life than among those not in their last year. These patterns were similar for males and females.
Average annual costs per person were much higher for young people in their last year of life than for young people not in their last year of life. With those aged 10–19, for example, average costs were 49 times as high for females and 39 times for males in their last year of life ($27,200 per female and $21,600 per male) compared with those not in their last year of life ($560 per female and $550 per male). However, by age 80 and over, the difference fell to 2.8 times as high for females ($14,700 compared with $5,200 per female) and 3.5 times as high for males ($19,900 compared with $5,700 per male).
Figure 1: Average annual number of health services used (a) and costs (b) per person by sex, age, service type and whether in last year of life
Figure 1 is a bar chart showing the average annual number of health services used (Figure 1a) and average annual cost of these services (Figure 1b) per person by sex, 10-year age group (from 0–9 years to 80+ years), health service type (ED presentations, hospital admissions, MBS services and prescriptions supplied under the PBS/RPBS) and whether people were in their last year of life or not. For each health service type, the average annual number of services used and associated costs for people in their last year of life generally increased with age until age 70, after which they fell. Average annual health service use and costs among people not in their last year of life generally increased steadily with age for each of the health service types except ED presentations. These patterns for people in and not in their last year of life were similar for females and males.

Average annual costs were 14 times as high for people in their last year of life
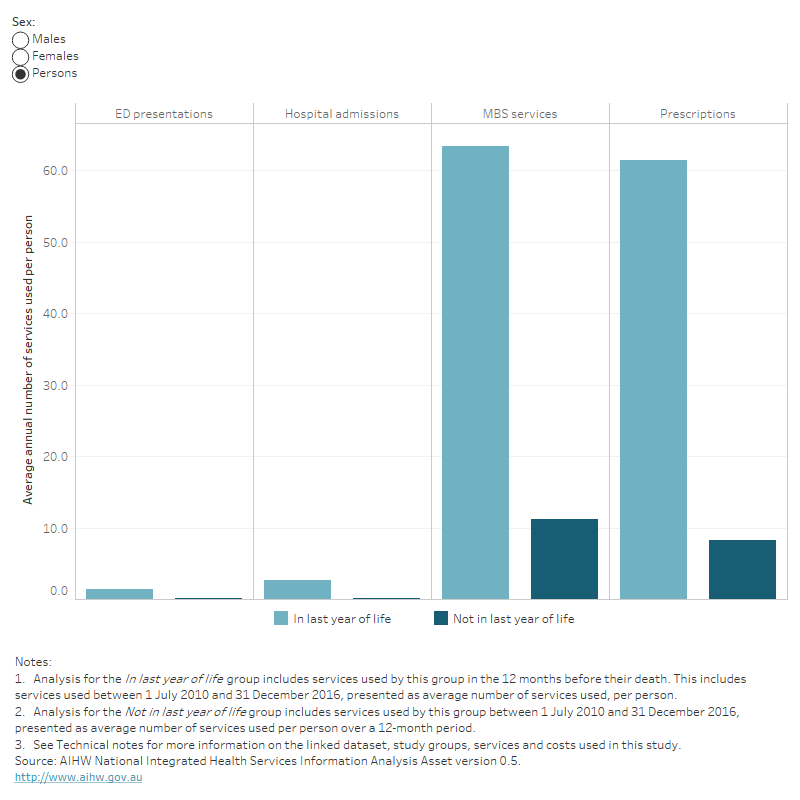
For each health service type, average annual service use was higher for people in their last year of life than for those not in their final year (Figure 2a). Average annual service use for people in their last year of life, when compared with those not in their final year, was:
- 26 times as high for hospital admissions (2.6 per person in last year of life compared with 0.1 per person not in their last year of life)
- 7 times as high for ED presentations (1.4 compared with 0.2)
- 5.7 times as high for MBS services (63 compared with 11)
- 7.5 times as high for prescriptions supplied under the PBS/RPBS (61 compared with 8.2).
Overall, the average annual cost per person for the 4 services combined for people in their last year of life was 14 times as high as the annual average cost person for people not in their final year ($24,000 and $1,700 per person respectively). Average annual costs for people in their last year of life, compared with those not in their final year, was:
- 30 times as high for hospital admissions ($15,100 per person in last year of life compared with $500 per person not in their last year of life)
- 14 times as high for ED presentations ($760 compared with $54)
- 11 times as high for prescriptions supplied under the PBS/RPBS ($3,800 compared with $353)
- 5.5 times as high for MBS services ($4,300 compared with $780).
When adjusting for the age profiles of these 2 study groups, the difference in the age-standardised average annual cost per person was slightly greater than the difference in the crude average annual costs per person (Table S2b).
Figure 2: Average annual number of health services used (a) and costs (b) per person by sex, service type and whether in last year of life
Figure 2 is a bar chart showing the average annual number of health services used (Figure 2a) and average annual cost of these services (Figure 2b) per person by sex, health service type (ED presentations, hospital admissions, MBS services and prescriptions supplied under the PBS/RPBS) and whether people were in their last year of life or not. For each health service type, average annual service use and costs were higher for people in their last year of life than for those not in their final year. Overall, the average annual cost per person for the 4 services combined for people in their last year of life was 14 times as high as the annual average cost person for people not in their final year ($24,000 and $1,700 per person respectively). The greatest difference was for hospital admissions, where the average annual cost per person in their last year of life was 30 times as high as people not in their last year of life ($15,100 and $500 per person, respectively).


