Baby characteristics
Birthweight and gestational age are interrelated and birthweight is generally expressed in relation to gestational age using population percentiles (refer to the Technical notes—Methods for more information on percentiles).
Gestational age and birthweight
A baby may be small due to being pre-term (born early), or due to being small for gestational age (either due to genetic factors, or because it is the subject of a growth restriction within the uterus). Poor fetal growth is associated with increased risk of perinatal death and with fetal distress during labour, and these babies are more likely to develop long-term health conditions later in life.
Adjusting birthweight for gestational age allows for differences in a baby’s growth status and maturity to be taken into account when examining their health outcomes at birth.
Babies are defined as being small for gestational age if their birthweight is below the 10th percentile for their gestational age and sex, as determined by national percentiles. Babies are defined as large for gestational age if their birthweight is above the 90th percentile for their gestational age and sex.
In 2018:
- Nearly 2 in 5 perinatal deaths (38.4%) occurred before 22 completed weeks gestation
- Rates of perinatal death decreased rapidly from 28 weeks gestation and were lowest among babies born at term (37-41 weeks).
The highest rates of perinatal death were among:
- Babies born at less than 22 weeks' gestation
- Babies born in the second trimester (less than 28 weeks’ gestation)
- Babies born with a birthweight less than 2,500 grams
- Babies who were small for gestational age (birthweight below the 10th percentile for their age and sex)
- Multiple births.
Perinatal mortality rates, by baby characteristics, 2018
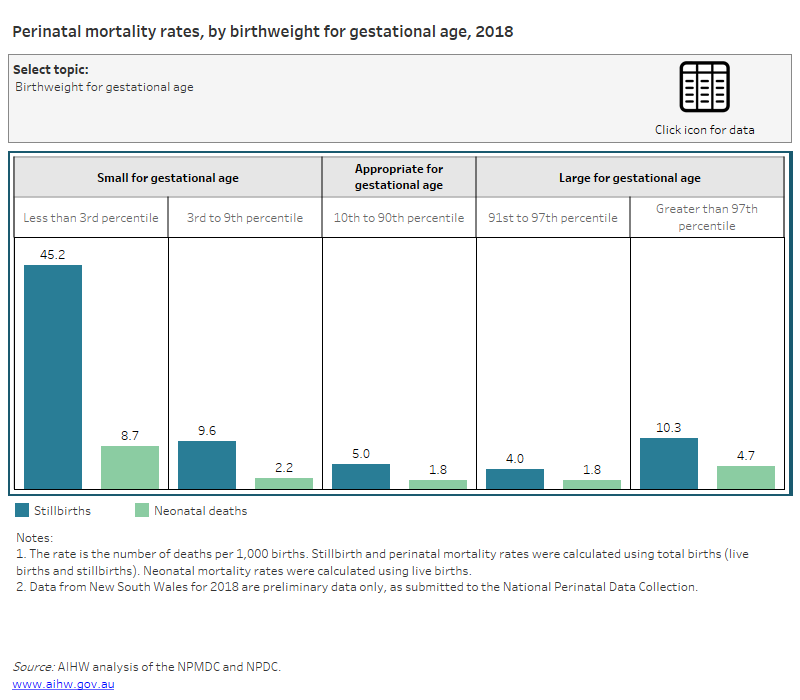
The bar charts in this data visualisation show the rates of both stillbirth and neonatal death by different baby characteristics. The first view shows the difference in rates by the baby’s birthweight for gestational age percentile. Rates of perinatal death were highest in babies born small for gestational age, or those with a birthweight below the 10th percentile for their gestational age and sex. The highest rates were in babies whose birthweight for gestational age was below the 3rd percentile for their gestational age and sex. The stillbirth rate for this category was 45.2 deaths per 1,000 total births, and the neonatal death rate was 8.7 deaths per 1,000 live births.
The difference in rates by birthweight groups shows that rates of stillbirth and neonatal death are highest for low birthweight babies, weighing less than 2500g. The rate of stillbirths for low birthweight babies was 82.5 per 1,000 births, compared to 0.9 for normal weight babies weighing between 2,500 and 4,499 grams. The rate of neonatal death for low birthweight babies was 25.8 per 1,000 live births, compared to 0.4 for normal weight babies weighing between 2,500 and 4,499 grams.
The difference in rates by gestational age group shows that rates of stillbirth and neonatal death decrease as a babies gestational age increases. The rate of stillbirths decreased from 790.0 deaths per 1,000 births at 20-22 weeks’ gestation to 1.1 deaths per 1,000 births at 36 weeks’ or more gestation. The rate of neonatal death decreased from 991.0 per 1,000 live births at 20-22 weeks’ gestation to 0.5 per 1,000 live births at 36 weeks’ or more gestation.
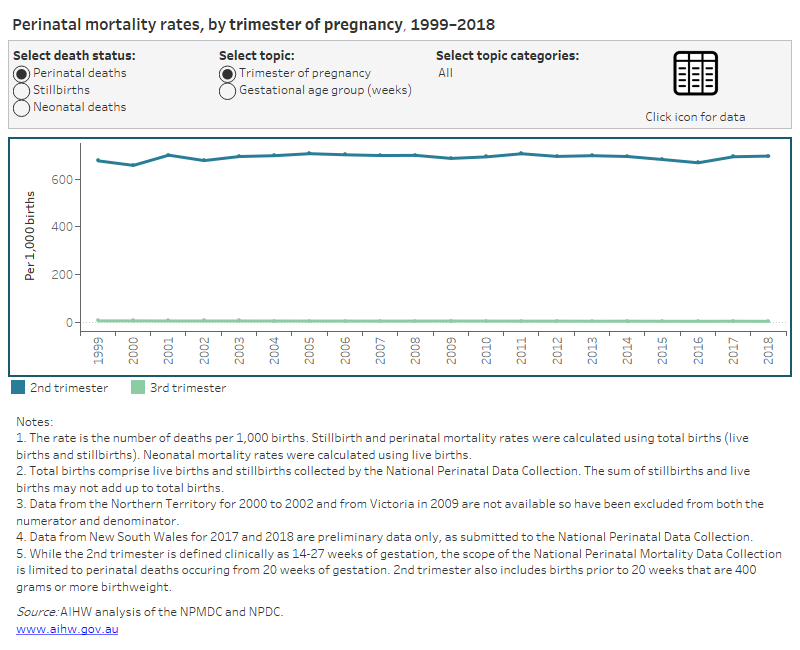
The difference in rates by trimester of pregnancy shows that rates of stillbirth and neonatal death are higher in the second trimester, or before 28 weeks’ gestation. The rate of stillbirths was 535.6 deaths per 1,000 births in the second trimester and 2.2 per 1,000 births in the third trimester. The rate of neonatal deaths was 348.3 deaths per 1,000 live births in the second trimester and 0.8 per 1,000 live births in the third trimester.
The difference in rates by plurality shows that rates of stillbirth and neonatal death increase as the number of babies in a pregnancy increases. The rate of stillbirths decreased from 57.3 deaths per 1,000 births for pregnancies with three or more babies to 6.6 deaths per 1,000 births for pregnancies with a single baby. The rate of neonatal deaths decreased from 49.7 deaths per 1,000 live births for pregnancies with three or more babies to 2.0 deaths per 1,000 live births for pregnancies with a single baby.
The underlying data for this data visualization are also available in the Excel spreadsheet located on the Data page.

Gestational age trend
While perinatal mortality rates have been holding relatively steady for babies born before 28 weeks’ gestation, they have been gradually decreasing among babies born after 28 weeks’ gestation.
Stillbirths occurring after 28 weeks of gestation, or in the third trimester of pregnancy, are known as late gestation stillbirths. Evidence indicates that these stillbirths are the most likely to be preventable (Flenady et al. 2016). The rate of late gestation stillbirths in Australia has decreased from 3.5 per 1,000 births in 1999 to 2.2 per 1,000 births in 2018.
Neonatal deaths in both the second and third trimesters of pregnancy have decreased over this period, with deaths in the third trimester decreasing from 1.3 per 1,000 births to 0.8 per 1,000 births in 2018.
Chart title: Perinatal mortality rates, by trimester of pregnancy and gestational age groups, 1999-2018
The stacked continuous line graphs in this data visualisation show the changes in perinatal deaths rates by two different measures of gestational age, trimester of pregnancy and clinical gestational age groups.
The continuous line graph for trimester of pregnancy shows that the perinatal mortality rate has held steady for babies born in the second trimester of pregnancy, or from 20-27 weeks in this data collection, from 676.6 deaths per 1,000 births in 1999 to 696.6 deaths per 1,000 births in 2018. The second trimester category also includes babies born at less than 20 weeks weighing 400g or more. Mortality rates for babies born in the third trimester, or from 28 weeks’ gestation, has decreased from 4.8 deaths per 1,000 births in 1999 to 3.0 deaths per 1,000 births in 2018.
The continuous line graph for gestational age group shows that the perinatal mortality rate have held relatively steady for babies born at 20-22 weeks gestation , from 990.5 deaths per 1,000 births in 1999 to 995.4 deaths per 1,000 births in 2018, for babies born at 23-26 weeks, from 572.7 to 581.2 deaths per 1,000 births over the same period, and for babies born at 27-31 weeks, from 132.0 to 123.2 deaths per 1,000 births. Mortality rates have decreased for babies born at 32-35 weeks, from 33.6 to 22.3 deaths per 1,000 births, and for babies born at 36 or more weeks, from 2.9 to 1.5 deaths per 1,000 births.
The underlying data for this data visualization are also available in the Excel spreadsheet located on the Data page.

References
- V Flenady et al., for The Lancet Ending Preventable Stillbirths study group and The Lancet Stillbirths In High-Income Countries Investigator Group 2016. Ending preventable stillbirths 4. Stillbirths: Recall to action in high-income countries.


