Key findings
GPs are often considered the frontline of Australia’s health care system, and deliver a wide range of services to prevent, diagnose, treat, and monitor both acute and chronic health conditions (AIHW 2018). Access to effective GP care may prevent conditions worsening and requiring use of emergency departments (ED) or hospitalisation.
Medicare subsidises the majority of GP visits Australians receive (Britt, Miller & Henderson et al. 2016). Medicare subsidises various GP services, including:
- Enhanced Primary Care services to support people who have chronic, mental or complex care needs
- After-hours services (non-urgent and urgent)
- Residential aged care visits.
9 in 10 Australians saw a GP
Around 21.6 million Australians visited a GP in 2017–18—or 88% of the population. However, use varied depending on where people lived. Across PHN areas, 94% of people living in South Western Sydney PHN visited a GP, compared with 77% of people living in the Northern Territory PHN (Figure 1).
Figure 1: Percentage of people who had a GP attendance, by Primary Health Network (PHN) area, 2017–18
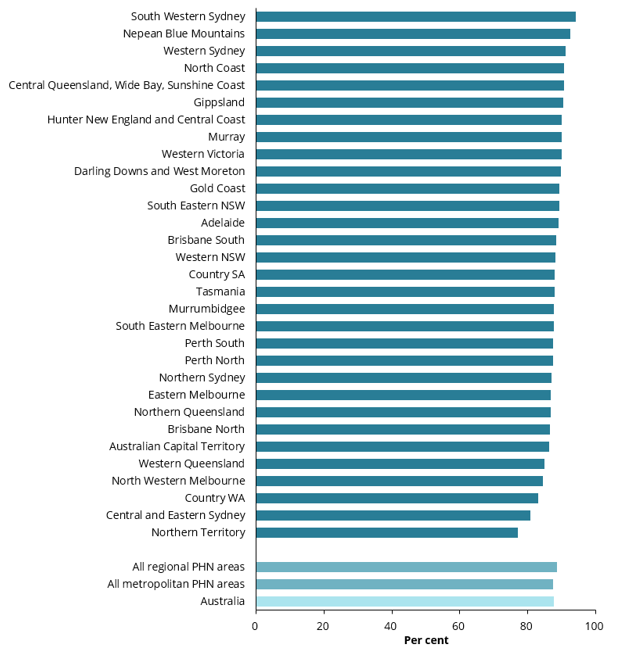
Chart: AIHW.
Sources: AIHW analysis of Department of Health, Medicare Benefits claims data; ABS ERP.
Between 2013–14 and 2017–18, there was a 1.6% relative increase in the percentage of the population using GP services, an 8% relative increase in the number of services per 100 people and a 16% relative increase in the Medicare benefits paid for GP services (Table 1).
|
Measure |
2013–14 |
2017–18 |
Relative change in rate since 2013–14 |
|---|---|---|---|
|
Proportion of people seeing a GP |
86% |
88% |
1.6% |
|
Number of GP services used per 100 people |
578 per 100 people |
627 per 100 people |
8.4% |
|
Total Medicare benefits paid for GP services per 100 people(a)(b) |
$27,300 per 100 people |
$31,686 per 100 people |
16.1% |
- Does not include government expenditure on bulk-billing incentives for non-referred attendances. In 2017–18, this amounted to $640 million, or $2,601 per 100 people. See the Technical Note for further details.
- Expenditure results are not adjusted for inflation.
Source: AIHW analysis of Department of Health, Medicare Benefits claims data; ABS ERP.
In some of the more remote PHN areas, there was a marked increase in the proportion of people using GP services during the 5 years. For example, in Western Queensland PHN area, 75% of the population saw a GP in 2013–14 compared with 85% in 2017–18.
The number of GP services per 100 people rose in some PHN areas. The largest increases were in Western Queensland (30%, from 399 to 519 per 100 people) followed by the Northern Territory (27%, from 362 to 459 per 100 people).
1 in 4 people had an Enhanced Primary Care GP visit
GPs play an important role in the diagnosis, treatment, planning, review and coordination of care for people with complex conditions, including chronic or terminal medical conditions. Medicare supports this type of care by subsidising Enhanced Primary Care services.
These services include health assessments for at-risk people, medication management reviews, the creation and review of treatment plans, and coordination of care for patients who require multidisciplinary, team-based care from a GP and at least two other providers.
In 2017–18, almost 1 in 4 Australians (23%, 5.6 million people) had a GP Enhanced Primary Care service, including:
- 15% (3.6 million people) had a chronic disease management plan prepared, coordinated or reviewed
- 8% (2.1 million people) had a GP Mental Health service involving the preparation or review of a GP mental health treatment plan or an extended consultation related to a mental health issue
- 4% (1.0 million people) had a Health Assessment for higher need groups.
These data relate to health services that are provided by a GP and claimed under specific Medicare Enhanced Primary Care item numbers. In particular, the reported number of patients who receive mental health and chronic condition related services from their GP is likely to be an underestimate of total mental health and chronic condition related activity undertaken by GPs, because these services can also be claimed against other general GP items.
Overall, a higher percentage of people living in regional PHN areas received Enhanced Primary Care services (25%) than people living in metropolitan PHN areas (21%). The percentage of people who received an Enhanced Primary Care service ranged from 16% in Australian Capital Territory PHN area to 34% of people in North Coast PHN area.
The proportion of the population receiving Enhanced Primary Care services has risen steadily in every PHN area since 2013–14. The largest rise was in Western Queensland from 14% of people in 2013–14 to 24% in 2017–18.
Residential and Home Medication Management Reviews are designed to enhance the quality use of medicines by helping patients and their carers to better manage their medicines. People aged 80 and over were the most common recipients of these services, accounting for more than half (53%) of the services claimed in 2017–18. The proportion of people aged 80 and over receiving these reviews dropped over the 5 years, with Residential Medication Management Reviews decreasing from 5.9% to 5.2% and Home Medication Management Reviews decreasing from 3.3% to 2.5% between 2013–14 and 2017–18.
For more information about inclusions in GP Enhanced Primary Care see Technical Note.
For more information on Medicare-subsidised Indigenous services, see AIHW’s Indigenous health checks and follow-ups report. Medicare data are presented for Aboriginal and Torres Strait Islander people by local area.
After-hours GP visits increasing
Access to GP after-hours services is important and may help to reduce visits to hospitals. Medicare subsidises urgent and non-urgent GP after-hours services, including those that take place in consultation rooms, in patients’ homes and in residential aged care facilities.
In 2017–18, about 1 in 4 Australians (24%) had an after-hours GP visit. Between 2013–14 and 2017–18, the number of people using after-hours GP services increased by 1.3 million, from 4.6 million (20% of people) in 2013–14 to 5.9 million (24%) in 2017–18.
People in metropolitan PHN areas were more likely to visit a GP after-hours (28%) than people from regional PHN areas (16%). Across PHN areas, after-hours GP visits ranged from 10% of people living in Western NSW to 37% of people in Western Sydney in 2017–18.
In Major cities, after-hours GP visits were highest in lower socioeconomic areas
In Major cities, the proportion of people who had an after-hours GP visit was higher in lower socioeconomic SA3 areas (34%), than in medium (27%) and higher (21%) socioeconomic areas. However, there was marked variation within similar socioeconomic areas within Major cities. Across lower socioeconomic local areas, the percentage of people who visited a GP after-hours ranged from 14% in Tweed Valley SA3 (NSW) to 51% in Tullamarine-Broadmeadows SA3 (Vic).
In 2017–18, 13% of GP after-hours visits were billed as urgent, with the remaining 87% billed as non-urgent. In particular, use of urgent after-hours GP services varied across the country, ranging from 1 urgent after-hours visit per 100 people in Western NSW PHN area to 17 visits per 100 people in Gold Coast PHN area.
For local area data on after-hours ED presentations for lower urgency care, see AIHW’s Use of emergency departments for lower urgency care: 2015–16 to 2017–18.
Allied health professionals provide a broad range of diagnostic, technical, therapeutic and direct health services to improve health and wellbeing, some of which are subsidised through Medicare (Box 2) (AHPA 2017). More than 1 in 3 Australians (37%, or 9.0 million) had at least one Medicare-subsidised allied health service in 2017–18, including:
|
|
Optometry services (claimed by 29% of people, 7.2 million) |
|
|
Psychology and other allied mental health care (5.1%, 1.2 million) |
|
|
Physical Health Care, including physiotherapy, exercise physiology, chiropractic services and osteopathy (4.3%, 1.1 million) |
|
|
Podiatry (4.2%, 1.0 million). |


Between 2013–14 and 2017–18, the proportion of people using Medicare-subsidised allied health services increased from 32% to 37%. In the same period, the number of services per 100 people rose from 73 to 92 per 100 people.
Who is using allied health services?
Older Australians were more likely to use a Medicare-subsidised allied health service than younger age groups. In 2017–18, 64% of people aged 65 to 79 years and 70% of people aged 80 and over had used an allied health service, compared with 31% of people aged less than 65 years.
However, younger Australians were more likely to see a Medicare-subsidised psychologist or allied mental health care worker than older age groups. Around 1 in 14 people (6.9%) aged 15–24 years had a Medicare-subsidised allied mental health service, compared with 1 in 20 people aged 25 or older (5.1%).
Box 2: What are Medicare-subsidised allied health services?
Allied health includes a broad range of services delivered by health practitioners who are not doctors, nurses or dentists. This includes audiologists, chiropractors, occupational therapists, optometrists, osteopaths, physiotherapists, podiatrists, psychologists and speech pathologists (AHPA 2017). Australians can use allied health services through many channels, including Medicare, general private health insurance (‘ancillary’ or ‘extras’ cover), or by paying for the service entirely out-of-pocket. At present, there is no national data on allied health service use outside of Medicare or private health insurance (AIHW 2018).
In 2017–18, private health insurers subsidised 52 million allied health-related services (APRA 2019). This compares with 23 million allied health services subsidised by Medicare in the same year. To assist with interpretation of Medicare-subsidised allied health services, general private health insurance data by state and territory are included in the accompanying data tables (APRA 2019).
Medicare-subsidised allied health services account for only a portion of all allied health service use in Australia, and, with the exception of optometry services, are generally only available to patients who are referred from a GP, or in some cases a specialist medical practitioner. Common referral pathways include GP Mental Health Treatment Plans for people with a mental health condition and GP Management Plans for people with a chronic health condition (these are Enhanced Primary Care GP services).
Allied health service use varies substantially
Use of allied health services varies considerably across the country. Across all 5 years, people living in North Coast PHN area were most likely to use a Medicare-subsidised allied health service (42% in 2017–18); in contrast, people living in Northern Territory PHN area were least likely (24% in 2017–18).
There was variation within age groups across areas. For instance, in 2017–18:
- 16% of people aged 65 and over in Gold Coast PHN area had a Medicare-subsidised Physical Health Care service (such as physiotherapy), compared with 5% in Western Queensland PHN area
- 10% of people aged 15–24 in North Coast PHN area visited a Medicare-subsidised psychologist or allied mental health worker, compared with 2% in Northern Territory PHN area.
Growing use of services provided by nursing and Aboriginal health workers in regional PHN areas
In 2017–18, 1.6 million Australians (6.3% of the population) received a Medicare-subsidised service provided by a nurse practitioner, practice nurse, midwife or Aboriginal health worker.
In the last 5 years, this has steadily increased (up from 725,000 people in 2013–14—3.1% of Australians). This growth has been largely driven by increases in regional PHN areas, with Northern Territory PHN area experiencing the highest increase in service use, up from 16 services per 100 people in 2013–14, to 47 per 100 people in 2017–18.
1 in 3 people visited a specialist
Around 1 in 3 Australians (31%, or 7.6 million people) visited a specialist outside of hospital in 2017–18. Overall, the proportion of people using specialist services was similar in metropolitan and regional PHN areas (Figure 2).
Figure 2: Percentage of people who had a specialist attendance, by Primary Health Network (PHN) area, 2017–18
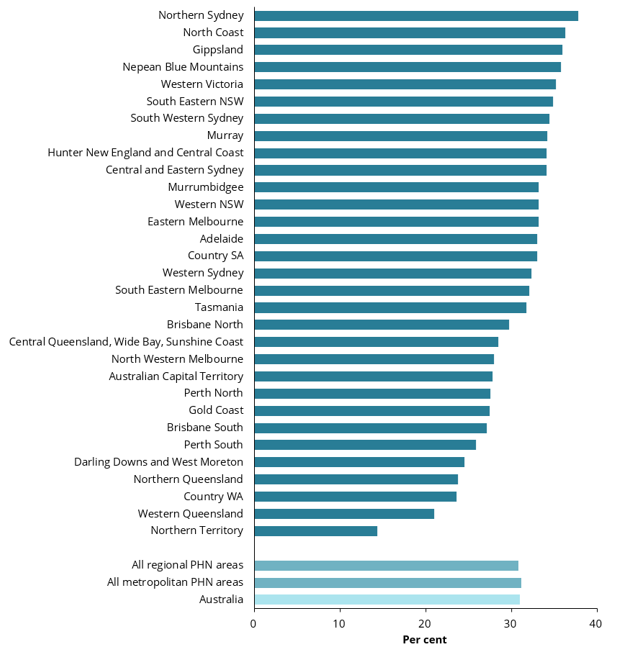
Chart: AIHW.
Sources: AIHW analysis of Department of Health, Medicare Benefits claims data; ABS ERP.
Use of specialist care is increasing. Between 2013–14 and 2017–18, there was a 4.8% relative increase in the percentage of the population using specialist services, a 6.3% relative increase in the number of services per 100 people and a 9.8% relative increase in the Medicare benefits paid for specialist services (Table 2).
|
Measure |
2013–14 |
2017–18 |
Relative change in rate since 2013–14 |
|---|---|---|---|
|
Proportion of people seeing a specialist |
29.6% |
31.0% |
4.8% |
|
Number of specialist services used per 100 people |
90 per 100 people |
96 per 100 people |
6.3% |
|
Total Medicare benefits paid for specialist services per 100 people(a) |
$7,382 per 100 people |
$8,105 per 100 people |
9.8% |
- Expenditure results are not adjusted for inflation.
Source: AIHW analysis of Department of Health, Medicare Benefits claims data; ABS ERP.
There was considerable variation across the country in each year — between 2013–14 and 2017–18, Northern Sydney PHN area consistently had the highest rate of specialist visits while Northern Territory PHN area had the lowest rate. In 2017–18, 38% of people in Northern Sydney PHN area visited a specialist compared with 14% of people in Northern Territory PHN area.
AIHW (Australian Institute of Health and Welfare) 2018. Australia’s health 2018. Australia’s health series no. 16. AUS 221. Canberra: AIHW.
AIHW 2019. Use of emergency departments for lower urgency care: 2015–16 to 2017–18. Cat. no. HSE 231. Canberra: AIHW.
APRA (Australian Prudential Regulation Authority) 2019. Private Health Insurance Benefit Trends — March 2019: Ancillary Benefits [Microsoft Excel spreadsheet]. Private health insurance statistical trends. Viewed 4 July 2019.
AHPA (Allied Health Professions Australia) 2017. What is allied health? Melbourne: AHPA. Viewed 4 July 2019.
Britt H, Miller GC, Henderson J, Bayram C, Harrison C, Valenti L et al. 2016. General practice activity in Australia 2015–16. General practice series no. 40. Sydney: Sydney University Press. Viewed 4 July 2019.
Department of Health 2018. Medicare Benefits Schedule book, operating 01 May 2018. Canberra: Department of Health.
Department of Human Services 2018. Medicare Australia statistics. Canberra: DHS. Viewed 4 July 2019.