
Interactive data on health risk factors and the neighbourhood environment
The interactive data visualisations below complement the PDF report and summary by enabling users to explore the data in more detail by filtering/customising the data and focus the figures to meet their information needs.
These data visualisations use data for Australian adults aged 18 and over from the 2017–18 Australian Bureau of Statistics National Health Survey. Further details on methodology and derivations can be found in the technical notes section below as well as the notes supplied within the supplementary data tables.
The interactive data visualisation provides an illustrative landing page to navigate various figures by clicking on the button of interest. These various figures further explore the relationship between proximity to fast-food outlets, supermarkets and public open spaces as well as average commuting distance with risk factors to health by socioeconomic area. All the data included in the visualisations can be found in the supplementary data tables.

Data source
The analyses are based on data collected in the 2017–18 National Health Survey conducted by the Australian Bureau of Statistics (ABS). This survey is based on a nationally representative cross-sectional sample that included residents of private dwellings. The survey excluded residents of non-private dwellings, such as hospitals, nursing homes, hotels, motels, boarding schools, and prisons as well as Very remote areas and discrete Aboriginal and Torres Strait Islander communities.
The survey sample size was 21,300 people. The survey collected information on measured height and weight as well as other risk factors, such as dietary intake and exercise.
For more information, refer to the ABS National Health Survey: First Results methodology, 2017–18.
Data quality statement
The data quality statement for the National Health Survey 2017–18 is available on the ABS website: 4363.0 - National Health Survey: Users' Guide, 2017–18 (abs.gov.au).
Measures
Socioeconomic areas
Information on socioeconomic areas in this report is based on Socio-Economic Indexes for Areas (SEIFA), a product developed by the ABS that ranks areas in Australia according to relative socioeconomic advantage and disadvantage. The indexes are based on information from the 5-yearly Census. Each index is a summary of a different subset of Census variables and focuses on a different aspect of socioeconomic advantage and disadvantage (ABS 2018b).
This report uses the Index of Relative Socio-economic Disadvantage (IRSD) from 2016, based on the Statistical Area Level 1 (SA1) that each household was within. Areas were ranked and put into 5 equally sized groups based on the IRSD score of these SA1s, and these groups form the socioeconomic areas used in this report. People within the 20% of areas with the greatest overall level of disadvantage are described as living in the lowest socioeconomic areas (areas of most disadvantage). People within the 20% of areas at the other end of the scale – those in areas with the least overall level of disadvantage – are described as living in the highest socioeconomic areas (areas of least disadvantage).
Fast-food outlet and supermarket classification
Counts of major fast-food chains and supermarkets within an area were calculated by road network. That is, the number of major fast-food chains and supermarkets based on the measured distance along the road network (distance along road(s) to amenity), to calculate more plausible travel routes. Independent supermarkets and fast-food providers were not included.
Eighteen fast-food chains were included:
- Crust Pizza
- Chicken Treat
- Domino's
- Donut King
- Eagle Boys Pizza
- KFC
- Hungry Jack's
- McCafe
- McDonald's
- Nando's
- Noodle Box
- Oporto
- Pizza Capers
- Pizza Haven
- Pizza Hut
- Red Rooster
- Subway
- Wendy's.
Ten supermarket chains were included:
- ALDI
- Coles
- Foodland
- Foodworks
- Franklins
- Fresh Market
- Friendly Grocer
- IGA
- Safeway
- Woolworths.
Public open space classification
In this report, public open spaces have been presented as public open spaces of any size and public open spaces greater than 1 hectare, which are accessible within the specified road network. Smaller public open spaces (for example, ‘pocket parks’) have been removed from these analyses as although these spaces may function as destinations to walk to, they may provide less opportunity for physical activity at the park itself. The data exclude Remote and Very remote areas of Australia.
Population density
The population density measures the population per square metre and was calculated by spatially intersecting the longitude/latitude associated with all household addresses in the NHS with the Australian Population Grid 2017. The grid represents population density at 1 km2 cells across Australia. In this report, areas were ranked and put into 5 equally sized groups based on the population density scores that contained about 20% of the population, based on the person sampling weights.
Those living in the 20% of areas with the lowest overall population density are described as living in the least dense areas. Those living in areas with the highest overall population density – the 20% of areas at the other end of the scale – are described as living in the most dense areas.
Mean and median commuting distance to work
Commuting distance measures the distance travelled from where a person usually lives to where they usually work. Mean and median commuting distance was calculated based on where people lived for all Statistical Area Level 1 (SA1s) in the 2016 Australian Census. This data was then spatially intersected with all household addresses in the NHS. That is, not all SA1s in Australia are included in our analyses. Commuting distance calculations assumed that a person followed the shortest road or network path or, where this was not possible, a straight line distance, with no stops.
For more information on how commuting distances are calculated, see: commuting distance for Australia.
Obesity
In this report, obesity was based on measured height and weight, and classified according to the WHO (2000) guidelines:
- overweight or obese was classified as a BMI ≥25 kg/m2
- obesity was classified as a BMI of 30.0 kg/m² or more (WHO 2000).
The non-response rates for physical measurements used to derive body mass index (BMI) for adults in the National Health Survey was 34%. However, the ABS imputed BMI for people for whom BMI was not measured. In this method, participants with a missing response were given the response of similar participants who were matched on age group, sex, part of state, self-perceived body mass, level of exercise, and whether a participant had high cholesterol as a long-term health condition (ABS 2019b).
Insufficient physical activity
Insufficient physical activity was classified according to those who did not meet the Australian Physical Activity Guidelines (Department of Health 2021a).
Australia’s Physical Activity and Sedentary Behaviour Guidelines recommend that Australian adults:
- aged 18–64 be active on most, preferably all days (that is, 5 or more) with at least 150 minutes of moderate or 75 minutes of vigorous intensity each week (or equivalent combination of both), and include muscle-strengthening activities on at least 2 days each week
- aged 65 and over be active on most, preferably all days (that is, 5 or more) with at least 30 minutes of moderate activity per day
- of all ages should aim to limit long periods of time spent sitting and break these up by standing or going on short walks where possible (Department of Health 2021a).
Based on the guidelines, in this report insufficient physical activity was defined as:
- adults aged 18–64 who did not complete 150 minutes of moderate to vigorous physical activity across 5 or more days in the last week
- adults aged 65 and over who did not complete at least 30 minutes of physical activity per day on 5 or more days in the last week.
Statistical analyses
Crude prevalence estimates
Crude prevalence estimates are presented as percentages in this report. Crude prevalence, as a percentage, is defined as the number of people with a particular characteristic, divided by the number of people in the population of interest, multiplied by 100.
In calculating crude prevalence estimates, where the information of interest (for example, BMI) was not available, these people were excluded from the denominator.
All crude prevalence estimates in this report are based on population weighted estimates allocated to each survey participant by the ABS to allow for national representativeness.
Age-standardised prevalence estimates
Age-standardised prevalence estimates are presented to remove the influence of age when comparing populations with different age structures. This is necessary because rates of certain risk factors, such as obesity, vary (usually increasing) with age.
The age-standardised proportions in this report have been directly age-standardised to the 2001 Australian Standard Population.
Standard error, relative standard error, margin of error and confidence intervals
For all survey data, the jack-knife weight replication method was used to derive the standard errors for each number estimate, using replicate weights provided by the ABS.
The standard error for the estimates was derived as follows:
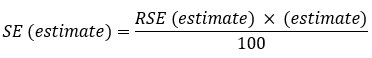 where RSE (estimate) is calculated as shown below.
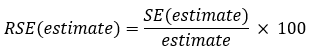
The relative standard error (RSE) of an estimate is a measure of the error likely to have occurred due to sampling. The RSEs of the estimates were calculated using the standard errors (SEs):
The margin of error (MoE) at the 95% confidence level for each estimate was calculated using 1.96 as the critical value:
MoE = 1.96 × SE(estimate)
The MoE was then used to calculate the 95% confidence interval (CI) around each estimate:
95% CI = estimate ± MoE(estimate)
Confidence intervals are used to describe the uncertainty around point estimates. There is a 95% chance that the calculated 95% CI contains the true population quantity being estimated.
Estimates with a margin of error of 10 percentage points or greater have been allocated a hash (#) and should be considered with caution.
Significance testing
Variation or difference in observed values or rates may be due to a number of causes including, among other things, actual differences in the study’s populations and sampling error. A statistical test of significance indicates how incompatible the observed data are with a specified hypothesis.
z-score
A difference between prevalence estimates was considered statistically significant if the 95% CIs around the estimates did not overlap. Where there was a small overlap between 95% CIs, a z-score for the difference in observed proportions was calculated using the following formula:
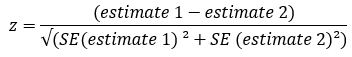
If the absolute value of the z-score was greater than or equal to 1.96, then the difference was reported as statistically significant at the 95% confidence level.
References
ABS (2018b) Census of Population and Housing: Socio-Economic Indexes for Areas (SEIFA), Australia, 2016, ABS website, accessed 29 July 2021.
ABS (2019b) National Health Survey: users' guide, 2017–18, ABS website, accessed 29 July 2021.
Department of Health (2021a) Australia's Physical Activity and Sedentary Behaviour Guidelines and the Australian 24-Hour Movement Guidelines, Department of Health website, accessed 1 June 2021.
WHO (World Health Organization) (2000) ‘Obesity: preventing and managing the global epidemic: report of a WHO consultation’, WHO technical report series, 894:1–253.