Appendix: Data and methods
Data sources
The data used in this project come from the Youth Justice National Minimum Data Set (YJ NMDS), which contains information on young people under supervision provided by departments responsible for youth justice. This supervision can occur in the community or in detention.
For this report, YJ NMDS data for most states and territories were available from 2000–01 to 2023–24.
For more information on YJ NMDS data quality and coverage, see the YJ NMDS Data Quality Statement at Youth Justice NMDS 2023–24: Quality Statement.
Linkage method
In the YJ NMDS, each young person has a state-specific person identifier. But, as the individual state and territory data sets in the YJ NMDS are not routinely linked, it is possible that an individual in one state or territory is also recorded in another state or territory.
For this project, data for the states and territories were linked using the AIHW’s key-based linkage method, which systematically varies available variables to increase the number of true matches, and reduce the number of false matches, while allowing for missing data.
For more information on this method, see Developing a linked data collection to report on the relationships between child protection and youth justice supervision (AIHW 2015).
After available data were linked, some young people had multiple sets of demographic information (date of birth, sex, and First Nations status). A single set of demographic information for each person was selected from the most recent year of data; where multiple sets of demographic information were available from this year; one set was randomly selected.
Analysis data sets
Cohorts
In most states and territories, young people are eligible for youth justice supervision only from the age of 10 (as children under the age of 10 cannot be held criminally responsible). In 2023, the Northern Territory and the Australian Capital Territory increased the minimum age of criminal responsibility from 10 to 12 years old. The upper age for receiving a sentenced youth justice order is 17 in some states and territories. The upper age in Queensland was increased from 16 to 17 after legislation was passed in November 2016 and enacted in February 2018.
This report looks at returns to sentenced supervision (that is, young people who receive an additional supervised sentence) for young people released from sentenced supervision in the same period (supervision cohorts), and for young people born in the same period (birth cohorts) (Table A1).
The birth cohorts for this analysis comprised all young people in the YJ NMDS born between 1990–91 and 2005–06, as these people would have all their sentenced youth supervision orders in the YJ NMDS (which has data from 2000–01 to 2023–24).
It is possible for young people over the age of 17 to be supervised by youth justice departments for various reasons; however, to ensure comparability, returns to supervision are counted only for the period in which all young people in most states and territories were eligible to be supervised by youth justice.
YJ NMDS data for Tasmania are available only from 2006–07, for the Australian Capital Territory from 2008–09 and for the Northern Territory from 2012–13.
The supervision cohorts comprise young people in the YJ NMDS of an age that makes them eligible to return to youth justice supervision in one year. This means young people were excluded if they were aged 17 or over at the time of release.
Time frame | Type of cohort | Years of birth | Years of supervision (Index sentence) | Years of supervision (return sentences) | Age at release (years) |
|---|---|---|---|---|---|
6 months | Supervision | n.a. | 2022–23 | 2022–23 to 2023–24 | 10–16 |
12 months | Supervision | n.a. | 2022–23 | 2022–23 to 2023–24 | 10–16 |
All possible supervision(a) | Birth | 1990–91 to 2005–06 | 2000–01 to 2023–24 | 2000–01 to 2023–24 | 10–17 |
n.a. = not applicable.
(a) Full cohort data are available for New South Wales, Victoria, Queensland, Western Australia and South Australia. Tasmania has 10 full birth cohorts available for analysis; the Australian Capital Territory has 8 and the Northern Territory has 3.
Index and return sentences
Supervision cohorts
For the supervision cohorts, the index sentence is the first completed supervised sentence in the relevant financial year. Where a young person has a detention and community sentence within the relevant financial year, both are counted as an index sentence.
Where there is more than one possible index sentence (because multiple sentences start on the same date), the sentence that ended first is selected; if this does not result in a single index sentence, and one of the possible index sentences is a detention sentence, the detention sentence is selected.
If there are multiple possible index sentences, but none is a detention sentence, a sentence is randomly selected from the set.
As the supervision cohorts comprise young people released from sentenced supervision in the same year, it is possible for individuals to appear in multiple cohorts. As well, the index sentence is not necessarily the young person’s first ever supervised sentence (that is, they might have had multiple supervised sentences before the index sentence for that particular time frame).
Birth cohorts
For the birth cohorts, the index sentence is the first supervised sentence that the young person received.
Where there is more than one possible index sentence, the sentence that ends first is selected; if this does not resolve the issue, and one of the possible index sentences is a detention sentence, the detention sentence is selected as the index sentence.
If there are multiple possible index sentences that end on the same date, and none is a detention sentence, a sentence is randomly selected from the set.
Return sentences are any sentenced supervision orders with a start date after the end date of the index order. Orders that are concurrent with the index sentence, including those that begin on the same day the index sentence ends, are not considered a return sentence (Figure A1).
Figure A1: Diagram of index and return sentences
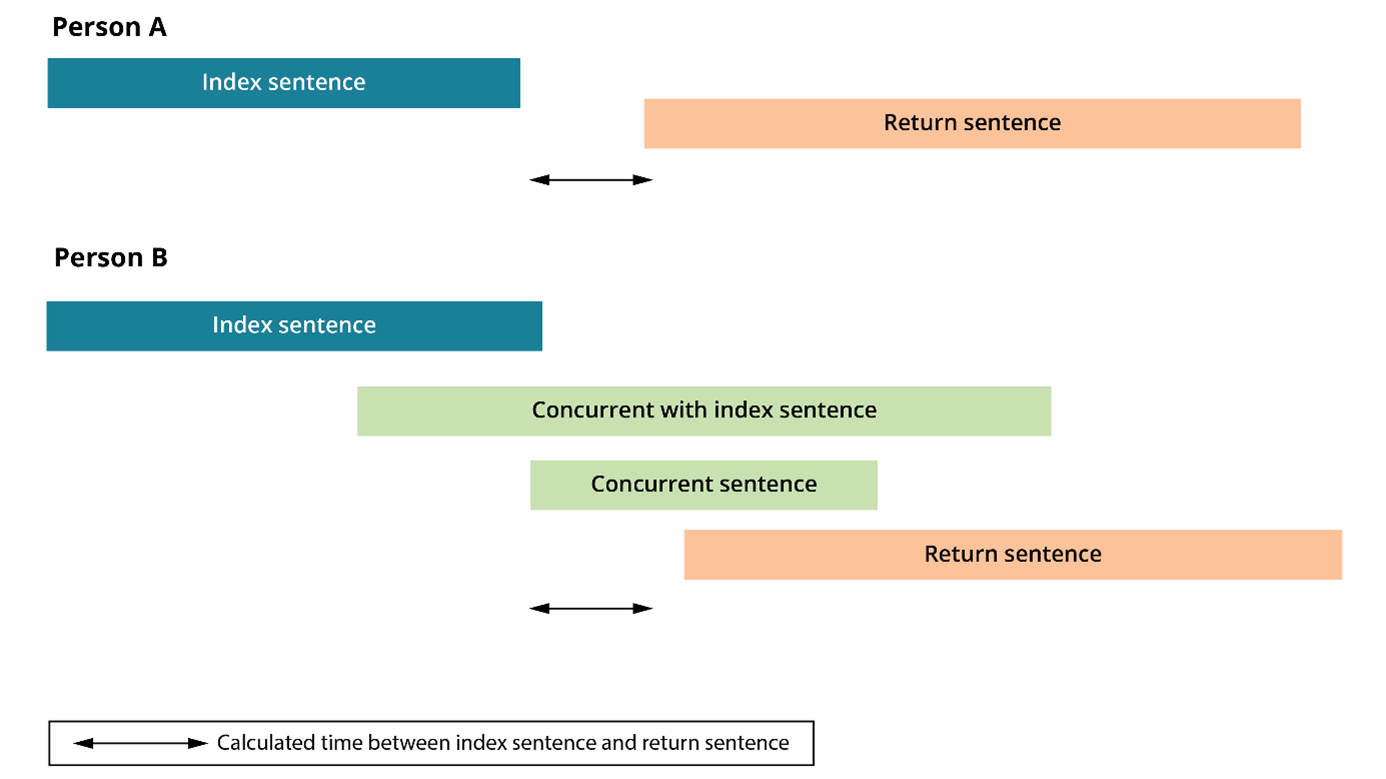
The time to return is calculated by subtracting the end date of the index sentence from the start date of the first return sentence.
In 2018–19, the method for calculating time to return was amended for the current year and the historical data. This resulted in an increase in the reported number of young people returning to sentenced supervision within 6 and 12 months for all states and territories. Therefore, data are not comparable with data in earlier editions of this report.
Some young people who exit detention are released into community-based supervision on parole or supervised release. Any returns that occur in this period are included, unless otherwise stated (see the section headed Exclusions below).
Number of previous supervised sentences
The count of previous supervised sentences was created by ordering the supervised sentences by start and end date. Where a supervised community-based sentence and a detention sentence share the same start and end date, the detention sentence is considered to have occurred before the community-based sentence for the purposes of counting the number of previous supervised sentences.
Incidence return rate for the birth cohort
An incidence return rate for age at the start of the first supervised sentence and for the length of the first index sentence was included in the current report. The incidence return rate was calculated as the total number of young people who returned after their first supervised sentence divided by the total amount of time (years) that the birth cohort spent at risk of return for each category (for example, by age group).
Incidence rate of return = total number of people returned / total number of person years at risk for all young people
Time spent at risk of receiving a return sentence was calculated for each young person in the birth cohort. Time at risk was calculated as the total number of days between the end date of the first supervised sentence and the start date of the return sentence. For young people who did not return to sentenced supervision, the at-risk period was the total number of days between the end date of the first supervised sentence and the date of turning 18. The number of days was converted to years by multiplying by 0.002738. For people who turned 18 during a first supervised sentenced order, their time at risk was 0. It is unknown if a person died after their first supervised sentence, but it is expected this number was very small and would make little meaningful difference to the results.
The incidence rate of return was rounded to 1 decimal place but is calculated from unrounded numbers.
Table A2 shows a worked example of how the incidence rate of return can be affected by the average time spent at risk of return per young person. The results are compared by age at first supervision for young people aged 12, 14 and 16. In this example, the return rate (the proportion of young people who had a previous supervised sentence who later returned) is kept constant at 50% for all age groups to isolate the impact to average time spent at risk of return. The average time spent at risk of return decreases by age group, regardless of whether the young person returned to sentenced supervision. This reflects:
- that the closer a young person is to turning 18, the less potential time they have to return to supervision
- the younger a person is at their first sentenced supervision, the more likely they are to have multiple periods of sentenced supervision.
The results from this worked example are similar, with young people aged 12 having the lowest incidence rate (0.16) and young people aged 16 having the highest incidence rate (0.35). The similar results indicate that the return rate is the same for all age groups.
Variable | 12-year-olds | 14-year-olds | 16-year-olds |
|---|---|---|---|
Number of young people supervised | 500 | 2,000 | 1,000 |
Number of young people who returned | 250 | 1,000 | 500 |
Number of young people who did not return | 250 | 1,000 | 500 |
Return rate | 50% | 50% | 50% |
Average time spent at risk of return in days: those who returned | 75 | 150 | 300 |
Average time spent at risk of return in days: those who did not return | 2,200 | 1,500 | 750 |
Average time spent at risk of return in years: those who returned | 0.21 | 0.41 | 0.82 |
Average time spent at risk of return in years: those who did not return | 6.02 | 4.11 | 2.05 |
Total person years at risk | 1,557 | 4,518 | 1,437 |
Incidence rate of return | 0.16 | 0.22 | 0.35 |
Notes:
- Example only – numbers are not based on real youth justice data.
- Return rate = (Number of young people who returned / Number of young people supervised) * 100
- Days converted to years by multiplying by 0.002738.
- Total person years at risk = (Number of young people who returned * Average time spent at risk of return for those who returned) + (Number of young people who did not return * Average time spent at risk of return for those who did not return)
In Table A3, the return rate is updated to reflect that the younger a person is at first supervision, the more likely they are to return to sentenced supervision. The average time spent at risk of return are unchanged from Table A2 to isolate the impact of updating the return rate. In this example, the return rate for young people:
- aged 12 is 90%
- aged 14 is 60%
- aged 16 is 30%.
Updating the return rates by age group has a considerable impact on the incidence rate of return, with young people aged 12 now having the highest incidence rate of return (1.14) of the 3 age groups and young people aged 16 having the lowest incidence rate of return (0.18).
The examples in Table A2 and A3 show that the incidence rate of return is affected by both the return rate and the average time spent at risk of return.
Variable | 12-year-olds | 14-year-olds | 16-year-olds |
|---|---|---|---|
Number of young people supervised | 500 | 2,000 | 1,000 |
Number of young people who returned | 450 | 1,200 | 300 |
Number of young people who did not return | 50 | 800 | 700 |
Return rate | 90% | 60% | 30% |
Average time spent at risk of return in days: those who returned | 75 | 150 | 300 |
Average time spent at risk of return in days: those who did not return | 2,200 | 1,500 | 750 |
Average time spent at risk of return in years: those who returned | 0.21 | 0.41 | 0.82 |
Average time spent at risk of return in years: those who did not return | 6.02 | 4.11 | 2.05 |
Total person years at risk | 394 | 3,778 | 1,684 |
Incidence rate of return | 1.14 | 0.32 | 0.18 |
Notes:
- Example only – numbers are not based on real youth justice data.
- Return rate = (Number of young people who returned / Number of young people supervised) * 100
- Days converted to years by multiplying by 0.002738.
- Total person years at risk = (Number of young people who returned * Average time spent at risk of return for those who returned) + (Number of young people who did not return * Average time spent at risk of return for those who did not return)
Exclusions
The following exclusions apply to both supervision cohorts (returns within 6 and 12 months), and to birth cohorts (returns at any time during possible youth justice supervision).