Australian Capital Territory
Quick facts
On an average day in 2020–21, in the Australian Capital Territory:
- 65 young people aged 10 and over were under youth justice supervision
- 13 per 10,000 young people aged 10–17 were under supervision
- Indigenous young people were 6 times as likely as their non-Indigenous counterparts to be under supervision.
Of those under supervision in the Australian Capital Territory on an average day:
- 86% were supervised in the community, and the rest in detention
- 76% were male
- 17% of those aged 10–17 identified as being of Aboriginal or Torres Strait Islander origin
- 9 young people in detention were unsentenced (awaiting the outcome of their court matter or sentencing).
Young people spent an average of about 25 weeks under supervision during the year.
Over the 5 years to 2020–21, the number of young people under supervision on an average day fell slightly from 77 to 65, with a high of 103 in 2017–18.
Impact of COVID-19 on youth justice data
This report includes data from March 2020 to June 2021, which coincides with the presence of COVID-19 in Australia. However, the direct impact of COVID-19 and related social restrictions on the number of young people under youth justice supervision is difficult to determine due to a range of factors including:
- variability of the data
- variations in state-based legislation, policy and practice
- small numbers of young people under youth justice supervision on an average night.
More research is required in order to better understand the impact of COVID-19 and related social restrictions on youth justice supervision across Australia.
Number and rate
On an average day in 2020–21, in the Australian Capital Territory:
- 65 young people aged 10 and over were under youth justice supervision (Table S138a)
- 86% were supervised in the community (Table S138b), and the rest (14%) in detention (Table S138c)
- the rate of supervision was 13 per 10,000 young people aged 10–17 (Table S139a)
- 12 per 10,000 young people aged 10–17 were under community-based supervision, and 2.0 per 10,000 were in detention (tables S139b and S139c).
Age and sex
On an average day in 2020–21, in the Australian Capital Territory:
- 83% of those under supervision were aged 10–17, and the rest were 18 and over
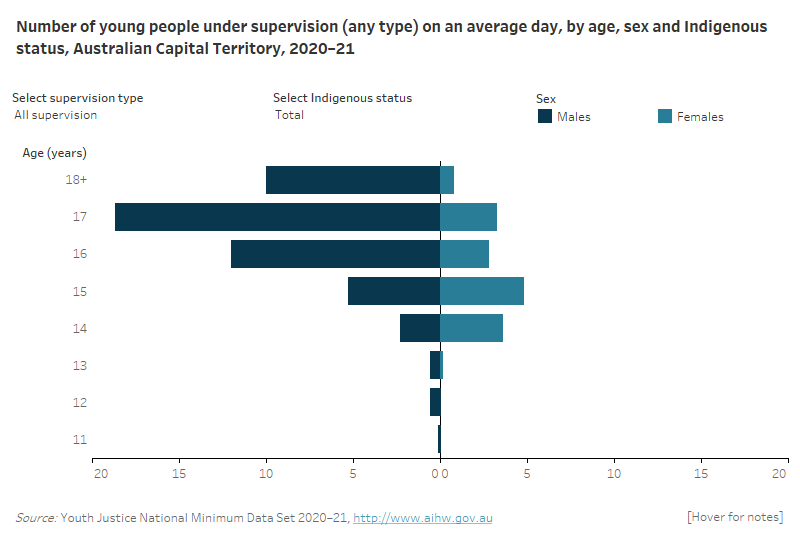
- just over 3 in 4 (76%) of those under supervision were male
- males under supervision were most likely to be aged 17, while females were most likely to be 15 (Table S138a).
ACT Figure 1: Number of young people under supervision on an average day by age, sex and Indigenous status 2020-21
This population pyramid shows the age, sex and Indigenous status under supervision, community-based supervision and detention for the Australian Capital Territory. The age distribution of males and females was broadly similar, however males under supervision were slightly older on average than females. The largest number of males under supervision were aged 17, while for females they were aged 15. Very few males and females under supervision were aged 13 and under.

Aboriginal and Torres Strait Islander young people
On an average day in 2020–21, in the Australian Capital Territory:
- Indigenous young people made up 3% of those aged 10–17 in the general population, but 17% (or 9) of those of the same age under supervision (tables S138a and S143)
- Indigenous young people aged 10–17 were 6 times as likely as non-Indigenous young people to be under supervision (75 per 10,000 compared with 12 per 10,000) (Table S139a).
Time under supervision
In 2020–21, in the Australian Capital Territory:
- the median duration of supervision periods that were completed during the year was 84 days (12 weeks) (Table S29)
- when all time spent under supervision during the year is considered, young people spent an average of 177 days (about 25 weeks) under supervision (Table S30).
Sentenced and unsentenced detention
On an average day in 2020–21, in the Australian Capital Territory:
- 9 young people in detention were unsentenced—that is, they were awaiting the outcome of their court matter, or had been found guilty and were awaiting sentencing
- 5 young people in detention were serving a sentence (Number of unsentenced and sentenced young people on an average day may not sum to total number of young people as young people may have been in both detention types on the same day) (Table S107a).
Trends to 2020–21
Over the 5 years to 2020–21, on an average day in the Australian Capital Territory:
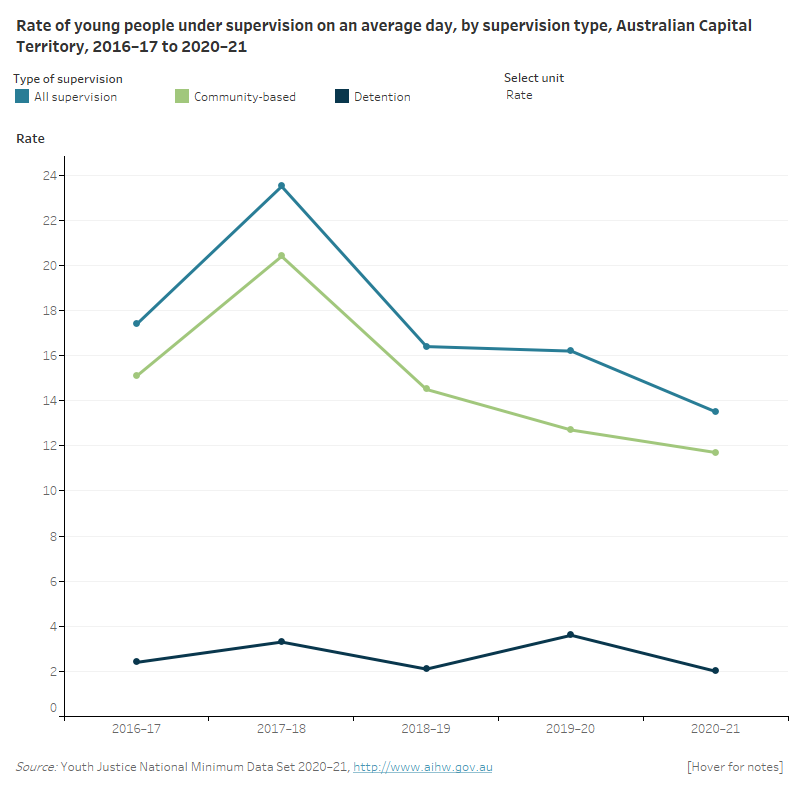
- the number of young people under supervision fell from 77 in 2016–17 to 65 in 2020–21, peaking to 103 in 2017–18 (Table S138a). The rate fell from 17 to 13 per 10,000 young people aged 10–17, with a high in 2017–18 of 24 per 10,000 (Table S12a)
- in community-based supervision, the number fell overall by 15%, with a high in 2017–18 (Table S138b), while the rate fell overall from 15 to 12 per 10,000, with a high of 20 per 10,000 in 2017–18 (Table S45a)
- in detention, the number fluctuated, but fell overall from 11 to 9 young people (Table S138c), while the rate fell from 2.4 to 2.0 per 10,000 (Table S83a).
ACT Figure 2: Number and rate of young people under supervision on an average day, by supervision type, 2016–17 to 2020–21
This line graph shows the number and rate of young people under supervision, community-based supervision and detention over the 5 years from 2016–17 to 2020–21 for the Australian Capital Territory. It shows a decline in the rate under supervision and community-based supervision since a peak in 2017–18, while the rate for detention was fluctuated over the 5-year period.

More information
This fact sheet is part of the Youth justice in Australia 2020–21 release, which includes a report, state and territory fact sheets, and supplementary data tables.
Together, these provide comprehensive information about young people under youth justice supervision in Australia due to their involvement, or alleged involvement, in crime.
For more information see the Youth justice topic.


