Clients
Client numbers and characteristics
In 2015–16, there were an estimated 133,895 clients who received treatment from publicly funded alcohol and other drug (AOD) treatment agencies across Australia. This is a rate of 559 clients per 100,000 people, or about 1 in 179 people in the general population. Around 96% of clients received treatment for their own drug use, and the remainder were receiving support and assistance for someone else's drug use.
The number of closed treatment episodes has increased over the last 10 years, from 147,325 in 2006–07 to 206,635 in 2015–16.
In the last year there has been a significant increase in the number of reported treatment episodes from 170,367 in 2014–15 to 206,635 in 2015–16. This increase is largely a result of improvements in reporting following the underreporting of treatment episodes and clients in 2014–15 due to system issues.
Client-level information is counted in the AODTS NMDS using a unique identifier—a statistical linkage key (SLK). For some records, the quality of SLK information is not good enough to use for counting clients. Therefore, an imputation strategy has been applied to account for these records and estimate the number of clients receiving treatment. This imputation has been applied to the total number of clients only. For more information on the imputation strategy see Alcohol and other drug treatment services in Australia 2013–14.
Age and sex
- Over half of all clients were aged 20–39 (55%), 32% were aged 40 and over and 13% were aged 10–19.
- The age profile of people using services is consistent with an ageing cohort—over the 10 years from 2006–07 to 2015–16, the percentage of people being treated who were aged 20–29 fell from 32% to 28% of treatment episodes, while those aged 40 and over rose from 26% to 32%. Similarly, the median age of clients seeking treatment has risen from 31 to 33 years from 2006–07 to 2015–16.
- Consistent with previous years, two-thirds (67%) of clients receiving treatment in 2015–16 were male (See Data Cube [Closed treatment episodes: all clients profile]).
Cultural and linguistic diversity
- In 2015–16, despite only comprising 2.7% of the Australian population aged 10 and over, 14% of AODTS clients were Indigenous Australians aged 10 years and over.
- Among the Australian population Indigenous clients were almost 7 times as likely to receive treatment services as non-Indigenous clients (Figure Client 1).
- The majority (87%) of treatment episodes in 2015–16 were for clients who were born in Australia, with the United Kingdom (3%) and New Zealand (2%) being the most common countries of birth for clients born outside Australia—unchanged from 2014–15. These proportions are generally consistent with the Australian population.
- In 2015–16, English was the preferred language of clients in 93% of treatment episodes.
Figure Client 1: Rate (per 100,000 population) of clients by age group and Indigenous status, 2015–16
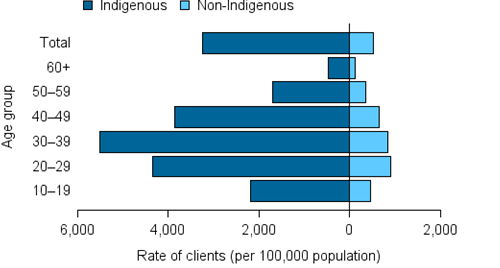
Source: AODTS NMDS. Data cube [Closed treatment episodes: all clients profile].
Drugs of concern
In 2015–16, the top principal drugs that led clients to seek treatment were alcohol (32% of treatment episodes), cannabis (23%), amphetamines (23%) and heroin (6%) (See Data cube [Closed treatment episodes: all clients profile]). These patterns and proportions were similar for Indigenous and non-Indigenous clients, although cannabis was a principal drug of concern for more Indigenous clients than non Indigenous clients (27% of treatment episodes, compared with 22%).
Across states and territories there were some variations in the top 4 principal drugs of concern. In most states and territories alcohol was also the top drug of concern; including NT (48% of episodes), ACT (42%), Tasmania (39%), NSW (37%) and Victoria (30%); whereas in SA and WA amphetamines were top, with 36% and 35% of episodes, respectively. In Queensland, Cannabis was the top drug, reported in 39% of episodes.
For those clients seeking treatment for their own drug use:
- Nationally, clients received an average of 1.6 treatment episodes in 2015–16.
- Almost half (45%) of clients received treatment for more than 1 drug of concern.
The proportion of episodes where clients were receiving treatment for amphetamines (23%) has continued to increase over the last 10 years, from 12% of treatment episodes in 2006–07, and from 20% in 2014–15. See Data cube [Closed treatment episodes for clients own drug use by principal drug of concern 2015–16].