

Children and youth
The first years of life provide the foundations for health, development and wellbeing. As a child gets older, early and continued engagement with, and successful completion of, primary and secondary schooling improves the likelihood of further study, and employment in adulthood. This section looks at some of the factors that affect the welfare of our young Australians.
We live in different types of families
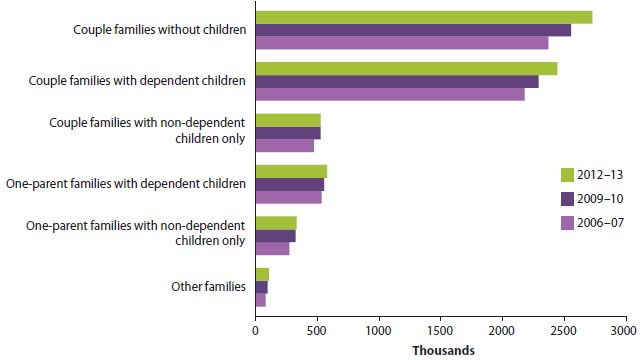
In 2012–13, there were 2.8 million families in Australia with children aged 17 and younger living in the household. Of these, 81% were couple families and 19% were one-parent families.
Of the 5.2 million children aged 0–17, 1 in 5 had a natural parent living elsewhere.
Family composition in Australia, 2012–13
Most kids are 'on track' when they start primary school
By the time they start primary school, around 4 in 5 children are developmentally 'on track'.
However, 22%—or about 60,000 children in 2012—were assessed as vulnerable on one or more domains:
- physical health and wellbeing
- social competence
- emotional maturity
- language and cognitive skills (school-based)
- communication skills and general knowledge.
Indigenous children are more than twice as likely as non-Indigenous children (43% compared with 21%) to be assessed as developmentally vulnerable on one or more domains.
Most children achieve literacy and numeracy standards at school
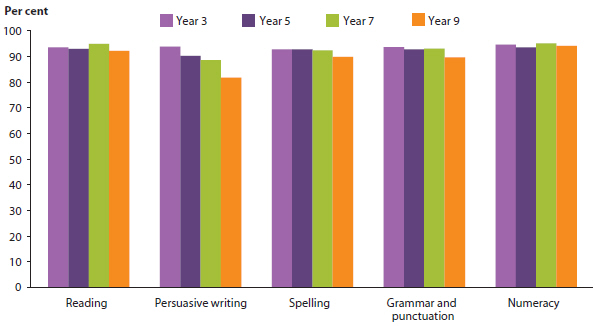
In 2014, most students in years 3, 5, 7 and 9 (82% to 95%) achieved at or above the national minimum standards in literacy and numeracy.
Indigenous students and students from Very remote areas achieved at or above the national minimum standards at much lower rates than for other student groups.
For example, in 2014, the rate of Indigenous students in Year 3 achieving at or above the national minimum standard was 20 percentage points lower than their non-Indigenous counterparts in reading and 18 percentage points lower in numeracy.
Students achieving at or above the NAPLAN national minimum standards, by Year level, 2014
4 in 5 young people are studying and/or working full-time
In Australia, schooling is compulsory until the completion of Year 10, and young people are obliged to participate in full-time education, employment or training (or a combination of these activities) until the age of 17.
The vast majority of young Australians will undertake tertiary education, begin an apprenticeship or traineeship, enter the workforce, or do a combination of these things. In 2014, 4 out of 5 (80%) young people aged 15–24 were fully engaged in education and/or employment.
While Indigenous young people aged 15–24 were less likely to be in education and training (44%) than non-Indigenous youth (59%) in 2011, their participation has increased slightly in recent years. In 2006, 42% of Indigenous young people were in education and training compared with 57% of non-Indigenous young people.
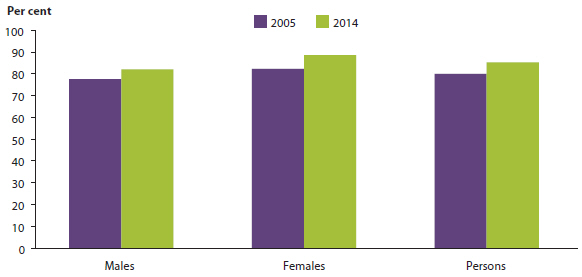
In 2014, the proportion of 20–24 year olds completing Year 12 or at least Certificate III was 85%, which was higher than in 2005 (80%). In 2013, 7% of all 15–24 year olds (219,500 people) were apprentices or trainees. This was slightly less than the 8% in 2004.
Completion of Year 12 or Certificate III and above among young people aged 20–24, by sex, 2005 and 2014
More young adults living with their parents
Young Australians are living at home with their parents for longer periods. They are also less likely to be marrying in their early 20s than a decade ago.
In 1997, 50% of young Australians aged 18–24 lived with their parents—by 2012–13, this had increased to 60%.
The rate of marriage for women aged 20–24 fell from 34 marriages per 1,000 in 2003 to 25 in 2013. For men, the rate dropped from 19 per 1,000 to 15 over the same period.
Fall in alcohol and drug use
While around 1 in 5 young people (21%) aged 18–24 years drank alcohol at risky levels for lifetime harm in 2013, this was less than the 2007 rate of 30%.
Males (28%) were more likely to drink at risky levels than females (15%).
Between 2001 and 2013, rates of recent illicit drug use for youth aged 18–24 fell from 37% to 29%. Use was higher among young males than among young females in 2013 (32% compared with 25%), and rates among youth were around twice as high as the population aged 25 and over (13%).
More children received child protection services
Children who are suspected of being abused, neglected or harmed, or whose parents are unable to provide adequate care or protection, may receive child protection services.
In 2013–14, about 143,000 Australian children aged 0–17 received child protection services, compared with 135,000 in 2012-13. In 2013-14, this was 1 in every 37 children.
Of these children, about 123,000 were aged 0–14.
Indigenous children aged 0–14 were 7 times as likely as non-Indigenous children to be receiving child protection services.
Indigenous youth over-represented in justice system
In 2013–14, on an average day, 920 young people aged 10–14 were under youth justice supervision (rate of 7 per 10,000 population). This was less than the 1,031 young people under supervision (rate of 8 per 10,000 population) in 2009-10.
This drop was mainly due to a fall in the number of young males under supervision—from 840 to 712 on an average day. There was, however, a small overall increase in the number of young females under supervision—from 191 to 208 on an average day.
The vast majority (82%) of young people aged 10–14 who were under supervision on an average day were supervised in the community.
Indigenous young people aged 10–14 were 23 times as likely to be under supervision and 36 times as likely to be in detention as young non-Indigenous people.
In 2013–14, there were 8,027 young people aged 15–24 under youth justice supervision (excluding Western Australia and Northern Territory), with 6,364 or 79% of these aged 15-17.
Despite making up only 4% of those aged 15-24 in the population, Indigenous young people made up 31% of those aged 15–24 under youth justice supervision.
Changing job front for youth
The profile of youth employment has changed significantly in recent decades, reflecting changes in the wider labour market and increased youth participation in education.
Youth labour force participation has declined (from 71% in 2008 to 67% in 2014), and those who are in the labour force have had greater difficulty finding employment—youth unemployment increased from 8.8% to 13.3% between 2008 and 2014.
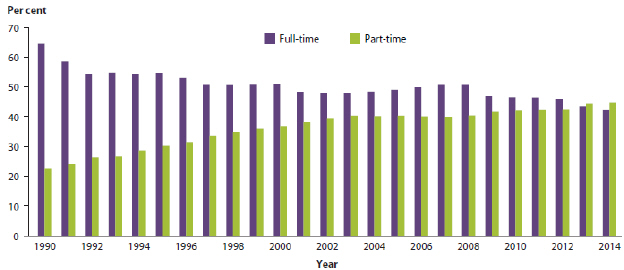
There have also been changes for employed youth. More employed youth are in casual jobs (rising from 35% in 1994 to 50% in 2013) and, for the first time, in 2013, the youth part-time employment rate (44%) exceeded the youth full-time employment rate (43%). This pattern continued in 2014 (45% and 42%, respectively).
These patterns mean that the move from education to full-time work is occurring later for youth—increasing from an average age of 21.8 years in 2008 to 23.4 in 2013.
Some young people combine paid employment with secondary or tertiary study to support themselves financially and to develop skills for long-term employment. In 2014, 29% of young people aged 15–24 combined study and work.
Full- and part-time youth employment rates, 1990 to 2014
Some young people are missing out
Young people who are not in education, employment or training are often referred to as the 'NEET' group.
In 2014, 10% of 15–24 year olds (312,900 people) were not in employment, education and/or training—this was the same proportion as in 2005.
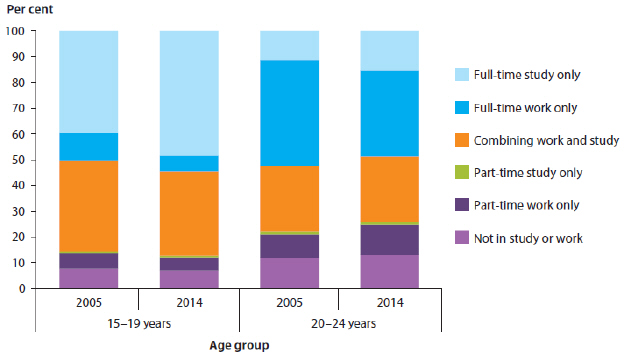
Participation in education and/or employment among young people aged 15 to 24, by age group, 2005 and 2014
In 2011, some 15–24 year olds were over-represented in the NEET group compared with their representation in the total youth population. These included:
- Indigenous youth (12% in the NEET group compared with 4% in the total youth population)
- youth who do not speak English well or at all (14% compared with 5%)
- youth needing assistance with basic activities of daily living (self-care, mobility or communication) (6% compared with 2%)
- those living in Inner regional and outer regional areas (31% in NEET compared with 25% in the total youth population) and Remote and very remote areas (5% in NEET, 2% in total youth population).