Expenditure and workforce
Australia's welfare system is a complex mix of services, payments and government and non-government providers. This section looks at two of the main components of service delivery: the government spending that funds the services, and the workforce – both paid and voluntary – that helps to deliver them.
Welfare spending up an average of 2.6% a year
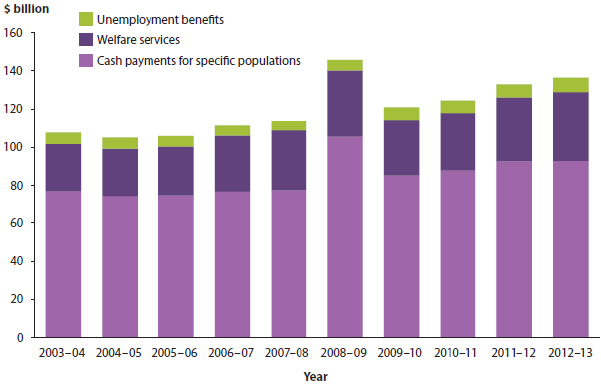
In 2012–13, the Australian and state and territory governments spent $136.5 billion on welfare.
Welfare spending grew at an average rate of 2.6% per year from 2003–04 to 2012–13 (adjusted for inflation). The growth in welfare spending was slightly lower than overall economic growth of 2.9% per year over the same period.
The biggest portion of government spending in 2012–13 – $93.1 billion (68%) – was in cash payments such as the Age Pension, Disability Support Pension and Carer Allowance (not including unemployment benefits).
This was followed by $35.9 billion (26%) for welfare services and $7.5 billion (5.5%) for unemployment benefits.
Spending on cash payments (excluding unemployment benefits) was up from $92.8 billion in 2011–12 and $77.0 billion in 2003–04 (adjusted for inflation).
In 2012–13, the largest share of cash payments – $40.1 billion – was for older people. Families and children received $28.2 billion and people with disability received $22.8 billion.
Between 2003–04 and 2012–13, cash payments grew by 6.4% per year for people with disability and by 2.8% for older people, while it fell by 0.7% per year for families and children.
Government welfare expenditure, by type of expenditure, adjusted for inflation, 2003–04 to 2012–13
A diverse welfare workforce
The welfare workforce is made up of people employed in both public and private organisations delivering welfare services, including early childhood education and care, residential care services, and a wide range of other social assistance services.
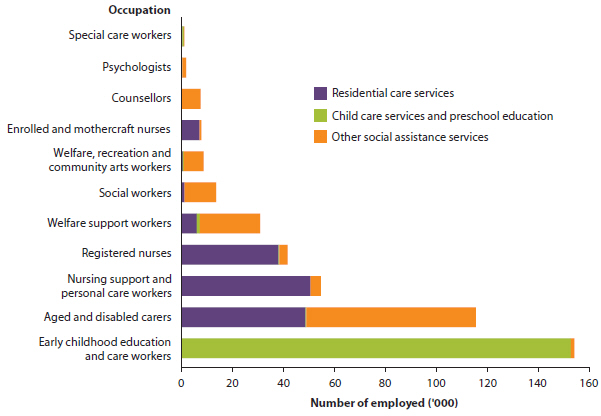
The workforce includes people in roles involved in direct service provision, and others, such as clerical and management workers. In 2014, there were about 449,000 paid workers in direct service provision roles in organisations providing welfare services. More than one-third of these people (34%) were early childhood education and care workers, mostly working in child care services and preschools.
The next largest group was aged and disabled care workers (26%), mainly working in residential care services and other social assistance services; followed by nursing support and personal care workers (12%), and registered nurses (9%), who were all mostly employed in residential care services.
People employed in direct service provision in welfare services, 2014
Majority of welfare workforce is female
Most welfare workers are female. For example, 94% of workers in child care centres, 90% in aged care services, 84-89% in child protection services and 77% in homelessness services, are female.
The pay earned by some workers in welfare-related fields is less, on average, than in other occupations.
For example, in 2014, the average weekly cash earnings of child carers ($537) and aged and disabled carers ($679) were substantially lower than cash earnings of workers across all occupations ($1,182).
While this gap is partly related to higher numbers of part-time workers, full-time workers in these occupations also tend to earn far less than their counterparts in other occupations.
Most informal carers are of working age
In 2012, about 2.7 million Australians were informal carers, providing help, support or supervision to family members, friends or neighbours with a range of physical and mental health conditions, and disability.
Informal care can include personal care (such as showering and support with eating), in-home supervision, transport, and help with shopping and medical needs. Most informal carers were aged 25–64 (67%), while 22% were aged 65 and over, and 11% were under the age of 25. More women (1.5 million) were carers than men (1.2 million), and most carers (71%) lived with the person receiving care.
The person responsible for the majority of informal caring is called the primary carer. Nearly two-thirds (65%) of primary carers aged 25–64 found it hard to meet everyday living costs because of their caring role.
Many people volunteer their time
Australians have a tradition of volunteering in many aspects of community life such as education, sport, safety and emergency services, and welfare services.
In 2010, about 6.1 million people did some voluntary work for an organisation in the previous 12 months. Volunteering rates were highest among people aged 45–54 (44%), followed by those aged 55–64 (43%) and 35–44 (42%).
Women (38%) were more likely to volunteer than men (34%).
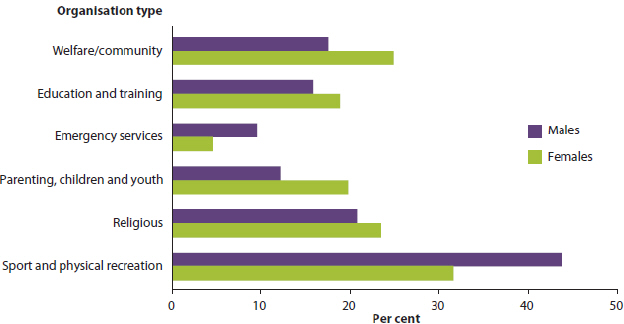
Most volunteers gave their time to sporting and recreation groups (44% of men volunteering, 32% of women), religious groups (21% of men, 24% of women) and welfare and community services (18% of men, 25% of women).
Volunteers aged 18 and over, by selected organisation type and sex, 2010
Key trends in Australia's welfare
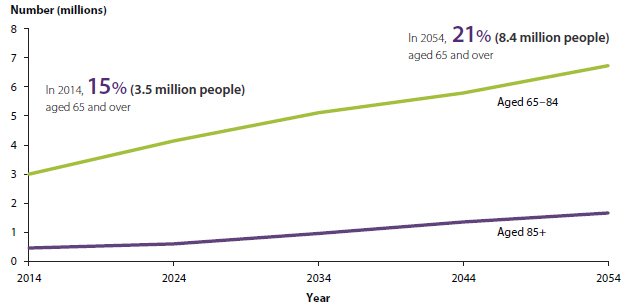
Ageing of the population
People with disability
In 2012, about 1 in 5 Australians had a disability.
The proportion of the population with disability has remained stable at 19% since 2009.
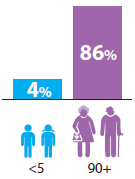
The prevalence of disability increases with age
Changing workforce
Between 1992 and 2014, the labour force participation rate has changed.
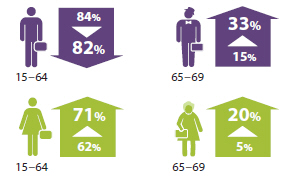
Men retire, on average, at 58 and women at 50. While this has changed little for men since 2004–05, it has increased from 47 years for women.
Home ownership
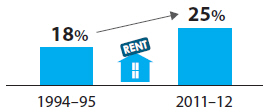
The proportion of households renting
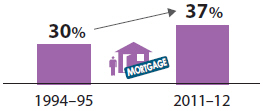
The proportion of households with a mortgage
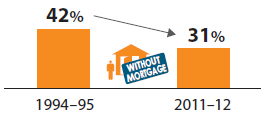
The proportion of households without a mortgage
Indigenous Australians
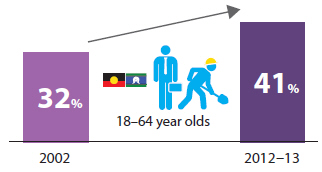
In 2012–13, government payments were the main source of income for
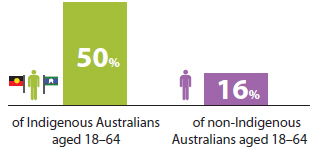
For Indigenous Australians, this proportion is down from 63% in 2002.
Indigenous Australians aged 18–64 whose main source of income was from employment
