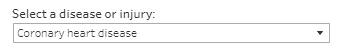
Use the drop-down list at the top right of the visualisation to view the data for a specific disease or injury.
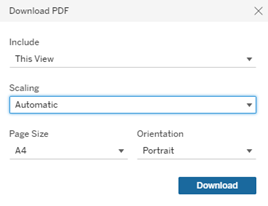
Click on the ‘Download PDF’ button to download a 1-page PDF for the selected disease/injury.

Select A4 in the Page Size drop-down.
Hover over the bars or lines on the charts for additional information.
The toolbar at the bottom of the visualisation enables users to interact with the data in different ways:

Undo = Undo the latest filter applied.
Redo = Redo the latest filter applied.
Revert = Clears all filters applied and reverts visualisation to default filters.
Refresh = Connects to the underlying data source and updates the visualisation with any changes in the data (not applicable to this visualisation).
Pause = Stops the visualisation from updating each time a filter is changed, enabling multiple filters to be changed at once. Clicking ‘Resume’ will update the visualisation according to the selected filters.
Download = Allows a downloadable file as either an image (PNG), PDF or PowerPoint file. This is a useful way to save a snapshot of the visualisation to include in a document or presentation.
Full screen = Displays the dashboard in full screen mode (press Esc to return to original view).
Share = Generates a link that can be shared (note that filters will not be applied when link is shared).
