Diseases and associated risk factors
Use the interactive graph below to explore a disease or injury to find out their associated risk factors and the impact on burden in Australia in 2024.
By selecting a disease group and a specific disease or injury, the risk factors that contribute to the development of the disease or injury, the proportion of disease burden each risk factor contributes to and the number of total burden in 2024 (DALY) are displayed.
Note that attributable burden estimates by risk factor here may differ to the estimates provided in the risk factor-specific visualisations provided elsewhere. This is due to a proportional scaling applied to each risk factor’s estimates to account for the relative impact of the joint effect calculation and mediation occurring between interrelated risk factors. It is not appropriate to sum the proportion of disease burden contributed by each risk factor for all forms of diabetes and chronic kidney disease, as these are considered entirely attributable to the risk factors high blood plasma glucose and impaired kidney function, respectively.
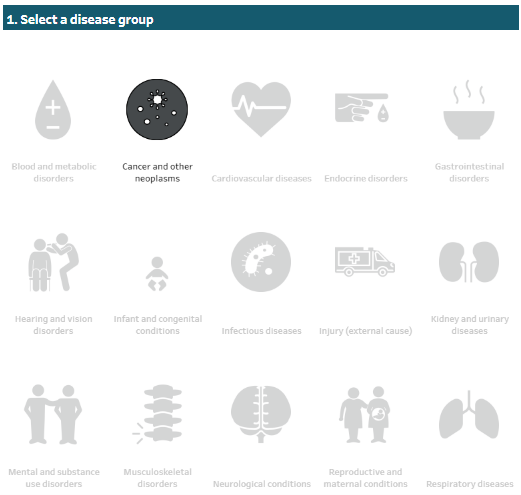
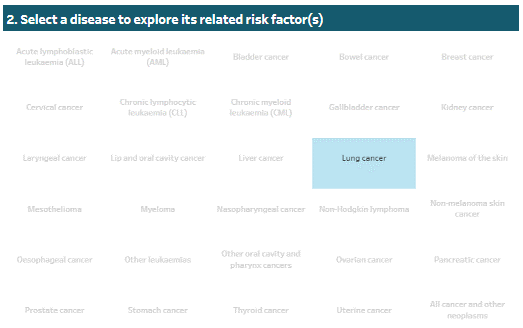
To filter the data, select a disease group by clicking on an icon in section 1, a disease in section 2, and then select a measure.
Hover over the bars on the charts for additional information.
The toolbar at the bottom of the visualisation enables users to interact with the data in different ways:

Undo = Undo the latest filter applied.
Redo = Redo the latest filter applied.
Revert = Clears all filters applied and reverts visualisation to default filters.
Refresh = Connects to the underlying data source and updates the visualisation with any changes in the data (not applicable to this visualisation).
Pause = Stops the visualisation from updating each time a filter is changed, enabling multiple filters to be changed at once. Clicking ‘Resume’ will update the visualisation according to the selected filters.
Download = Allows a downloadable file as either an image (PNG), PDF or PowerPoint file. This is a useful way to save a snapshot of the visualisation to include in a document or presentation.
Full screen = Displays the dashboard in full screen mode (press Esc to return to original view).
Share = Generates a link that can be shared (note that filters will not be applied when link is shared).
Figure 4.7: Burden of linked diseases due to risk factors in Australia
This interactive visualisation reports the burden from related risk factors for a selected disease or injury, by selected measure.
