Key population groups
On this page:
State and territory
Burden due to suicide and self-inflicted injuries varies by state and territory. After adjusting for population increase and ageing, total burden rates in 2019 were lowest in Victoria (4.9 DALY per 1,000 population) and highest in the Northern Territory (9.2 DALY per 1,000). Victoria also had the lowest age-standardised rate for fatal burden (4.8 YLL per 1,000) and the Northern Territory had the highest (9.1 YLL per 1,000) (Figure 5; Table S5). The rates of both total and fatal burden due to suicide and self‑inflicted injuries in the Northern Territory were 1.6 times as high as the national rates (9.2 compared with 5.9 DALY per 1,000; and 9.1 compared with 5.8 YLL per 1,000) in 2019.
Figure 5: Age-standardised rate of burden (DALY, YLL and YLD) due to suicide and self-inflicted injuries, by state and territory and sex, 2011, 2015, 2018 and 2019
This bar chart presents the distribution of age-standardised rates of total, fatal and non-fatal burden by state and territory and sex in each reference year, from 2011 to 2019. In 2019, the Northern Territory had the highest age-standardised rates of total burden for males and females (11.3 and 7.0 DALY per 1,000 respectively). Victoria had the lowest rates of total burden for males and females (7.5 and 2.3 DALY per 1,000 respectively)
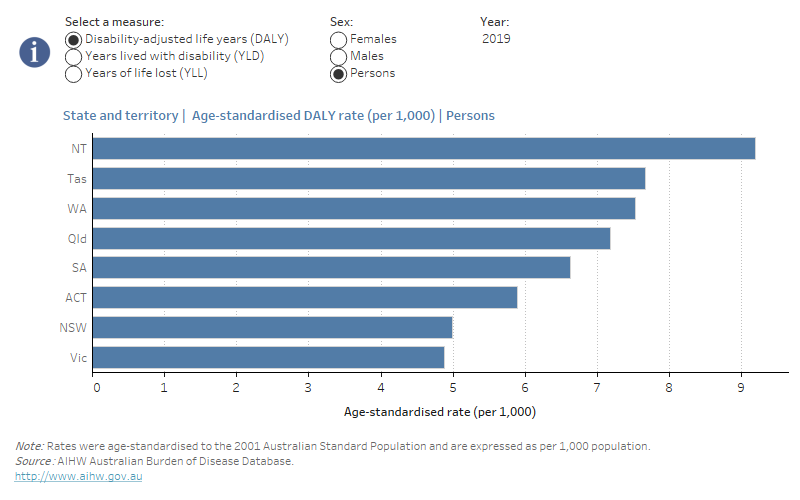
Non-fatal burden due to suicide and self-inflicted injuries was also highest in the Northern Territory, where the age-standardised rate was 2.1 times the national rate (0.11 compared with 0.05 YLD per 1,000 population). Non-fatal burden rates for the other states and territories ranged from 0.04 to 0.07 YLD per 1,000. Caution should be used when interpreting these figures due to small numbers.
Males and females aged 15–24 in the Northern Territory experienced the highest rates of total, fatal and non-fatal burden of suicide and self-inflicted injuries in 2019 (Figure 6; Table S6). Total burden rates were around 31 DALY per 1,000 population for both males and females in this age group in the Northern Territory.
Figure 6: Number and rate of burden (DALY, YLL and YLD) due to suicide and self-inflicted injuries, by state and territory, age group and sex, 2019
This grouped bar chart presents the distribution of the number and age-specific rates of total, fatal and non-fatal burden due to suicide and self-inflected injuries, by state and territory and sex in 2019. For each sex and type of burden, it allows the comparison of age-specific burden rates by age group across the states and territories. In 2019, males and females aged 15–24 in the Northern Territory experienced the highest rates of total, fatal and non-fatal burden due to suicide and self-inflicted injuries.
Total burden rates were highest for people aged 15–24 in all states and territories except Western Australia – where 25–34 year olds had the highest rate – and Tasmania, where 45–54 year olds had the highest rate.
Between 2011 and 2019, the age-standardised rate of total burden of suicide and self‑inflicted injuries increased in each state and territory except the Northern Territory, where it fell by 7.9% for all people (from 10.0 to 9.2 DALY per 1,000 population) and by 25% for males (from 15.1 to 11.3 DALY per 1,000 population) (Figure 5; Table S5). The total burden rate increased, however, for females in the Northern Territory (by 66%; from 4.2 to 7.0 DALY per 1,000 population).
The Australian Capital Territory experienced the largest increase in the age-standardised rate of total burden due to suicide and self-inflicted injuries for all people (61%; from 3.7 DALY per 1,000 population in 2011 to 5.9 DALY per 1,000 in 2019) and for males (95%; from 4.8 DALY per 1,000 population in 2011 to 9.3 DALY per 1,000 in 2019). For females, the total burden rate fell by 5.1% in the Australian Capital Territory (from 2.6 DALY per 1,000 to 2.5 DALY per 1,000) (Figure 5; Table S5). However, it should be noted that these trends are based on relatively small numbers and should be interpreted with caution.
These trends were also observed for the fatal burden due to suicide and self-inflicted injuries.
Remoteness area
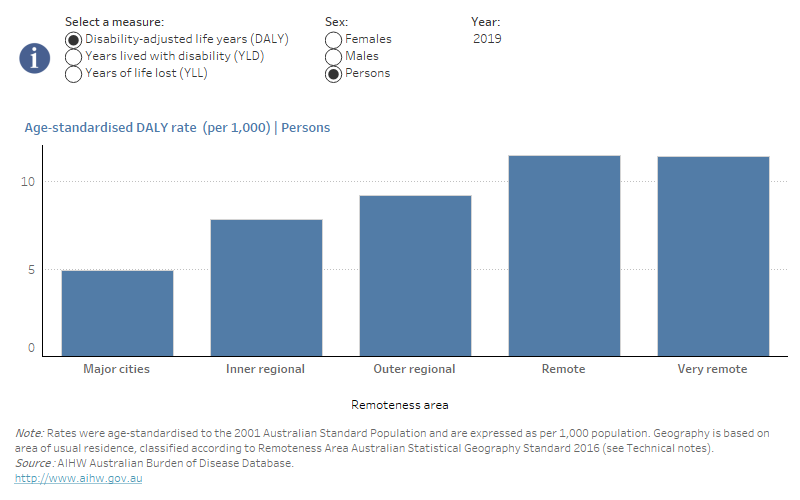
The rate of burden due to suicide and self-inflicted injuries generally increased with increasing remoteness in 2019 (Figure 7; Table S7). The rate of total burden was highest in Remote areas (11.5 DALY per 1,000 population) and Very remote areas (11.4 DALY per 1,00), around 2.3 times the rate in Major cities (4.9 DALY per 1,000). A similar pattern was observed for both fatal and non-fatal burden.
Figure 7: Age-standardised rate of burden (DALY, YLL and YLD) due to suicide and self-inflicted injuries, by remoteness area and sex, 2015, 2018 and 2019
This bar chart presents age-standardised rates of total, fatal and non-fatal burden due to suicide and self-inflected injuries by remoteness and sex for the reference years 2015, 2018 and 2019. It shows the comparison across the five remoteness areas: Major cities, Inner regional, Outer regional, Remote and Very remote areas.
In 2019, the rate of burden of suicide and self-inflicted injuries generally increased with increasing remoteness. The rate of total burden was highest in Remote areas (11.5 DALY per 1,000 people) and Very remote areas (11.4 DALY per 1,000 people), around 2.3 times the rate in Major cities (4.9 DALY per 1,000 people). A similar pattern was observed for both fatal and non-fatal burden.
In 2019, males experienced more total and fatal burden from suicide and self-inflicted injuries in each remoteness category, with the largest difference being in Inner regional areas where the rates in males were around 3.5 times as high as those in females. In contrast, non-fatal burden was higher among females than males in every remoteness category.
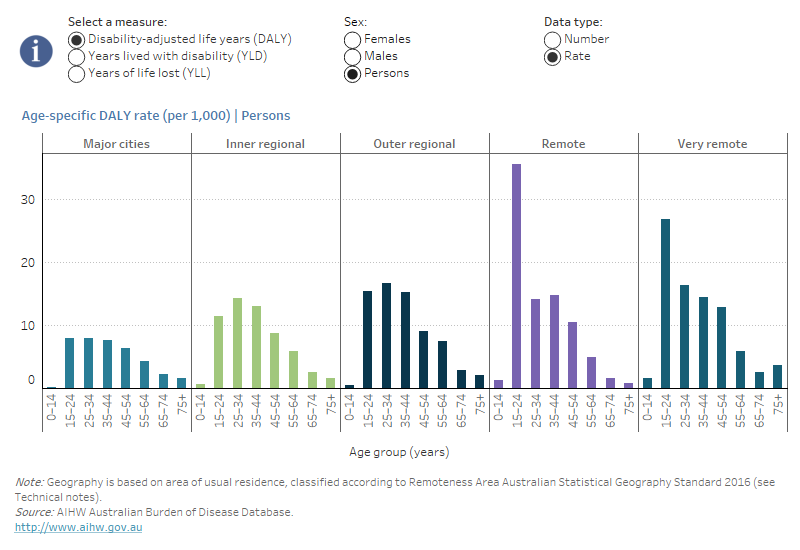
People aged 15–24 living in Remote areas had the highest rate of total suicide burden in 2019 (35.4 DALY per 1,000 population) and the highest rate of fatal burden (35.2 YLL per 1,000) (Figure 8; Table S8). Those aged 15–24 living in Very remote areas had the second highest rates of total and fatal burden (26.8 and 26.6 per 1,000, respectively). The highest rates of non-fatal burden also occurred among people aged 15–24 living in Remote and Very remote areas (0.2 YLD per 1,000).
Times series data by remoteness are presented only for 2015 to 2019 due to changes in Census remoteness boundaries since 2015. Between 2015 and 2019, the age‑standardised rate of total burden of suicide and self-inflicted injuries increased by 12% in Inner regional areas and by 13% in Remote areas. Rates remained relatively stable in Major cities, Outer regional and Very remote areas (Table S7). Similar trends occurred for fatal burden between 2015 and 2019.
Figure 8: Number and rate of burden (DALY, YLL and YLD) due to suicide and self-inflicted injuries, by remoteness area, age group and sex, 2019
This grouped bar chart presents the number and age-specific rates of total, fatal and non-fatal burden by remoteness area and sex in 2019. For each sex and type of burden, it shows the age distribution within each of the five remoteness areas, allowing comparison of the burden by age group across these remoteness areas.
In 2019, people aged 15–24 years living in Remote areas had the highest rates of total, fatal and non-fatal suicide burden (35 DALY per 1,000; 35 YLL per 1,000; and 0.2 YLD per 1,000 respectively), while those aged 15–24 years living in Very remote areas had the second highest rates (27 DALY per 1,000; 27 YLL per 1,000; and 0.2 YLD per 1,000 respectively).
Socioeconomic area
Socioeconomic areas are presented as approximate quintiles in this report. The lowest quintile (Quintile 1, or Q1) represents the approximate 20% of the population living in areas with the lowest socioeconomic characteristics; that is, it is the most disadvantaged. The level of socioeconomic position increases with each quintile, through to the approximate 20% of the population living in areas with the highest socioeconomic characteristics (Quintile 5, or Q5); that is, the least disadvantaged.
In 2019, the age-standardised rates of total, fatal and non-fatal burden of suicide and self-inflicted injuries increased with increasing socioeconomic disadvantage (Figure 9). This was true for both males and females (Table S9). The rate of burden in the lowest socioeconomic areas (most disadvantaged areas) (7.9 DALY per 1,000 population) was 2.0 times the rate of the highest (least disadvantaged) socioeconomic areas (3.9 DALY per 1,000).
Figure 9: Age-standardised rate of burden (DALY, YLL and YLD) due to suicide and self-inflicted injuries, by socioeconomic area and sex, 2015, 2018 and 2019
This bar chart presents the age-standardised rates of total, fatal and non-fatal burden by the five socioeconomic areas (Quintile 1, Quintile 2, Quintile 3, Quintile 4 and Quintile 5, with Quintile 1 being the area with the most socioeconomic disadvantage and Quintile 5 being the area with the least) and sex in the reference years 2015, 2018 and 2019. In 2019, the age-standardised rates of total, fatal and non-fatal burden due to suicide and self-inflicted injuries increased with increasing socioeconomic disadvantage for both males and females. The rate of total burden was 2 times as high in the lowest socioeconomic area (7.9 DALY per 1,000) as that in the highest area (3.9 DALY per 1,000).
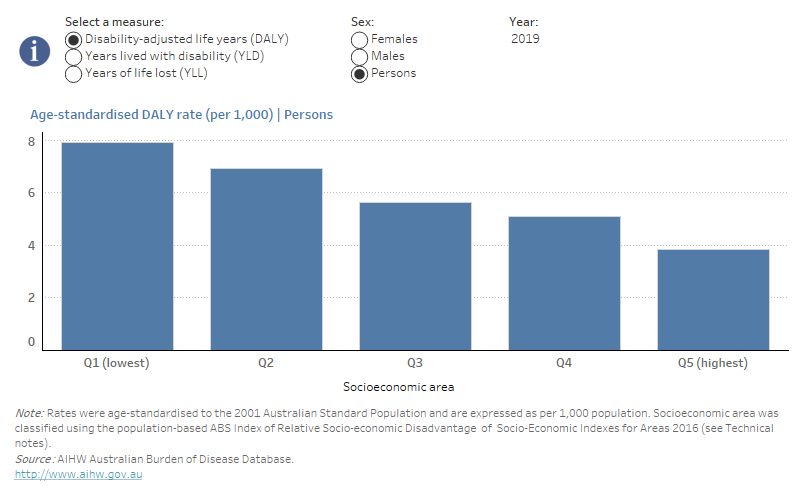
The rate of fatal burden in the lowest socioeconomic areas (7.8 YLL per 1,000 population) was also 2.0 times the rate of the highest socioeconomic areas (3.8 YLL per 1,000), while the rate of non-fatal burden was 1.8 times as high in the lowest socioeconomic areas (0.07 YLD per 1,000) as in the highest socioeconomic areas (0.04 YLD per 1,000).
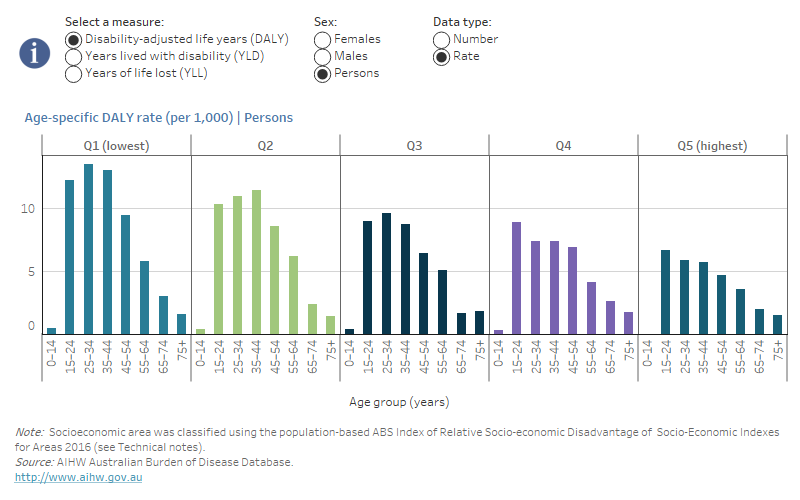
Age-specific rates of total burden due to suicide and self-inflicted injuries showed a fairly similar pattern by socioeconomic area, being highest among those aged 15–44. People aged 25–34 in the lowest socioeconomic areas had the highest rate of burden of suicide and self-inflicted injuries in 2019 (13.6 DALY per 1,000 population) (Figure 10; Table S10).
Times series data by socioeconomic area are presented for 2015 to 2019 only, due to changes in Census boundaries used to calculate Socio-Economic Indexes for Areas since 2015. Between 2015 and 2019, the age-standardised rate of total burden of suicide and self-inflicted injuries remained relatively stable in each socioeconomic area, except in socioeconomic area Quintile 2 (the second most disadvantaged areas) where there was an 12% increase (from 6.2 DALY per 1,000 population to 6.9 DALY per 1,000) (Figure 9; Table S9).
Figure 10: Number and rate of burden (DALY, YLL and YLD) due to suicide and self-inflicted injuries, by socioeconomic area, age group and sex, 2019
This grouped bar chart presents the number and age-specific rates of total, fatal and non-fatal burden due to suicide and self-inflected injuries by socioeconomic area and sex in 2019. It shows the age distributions in each of the five socioeconomic areas, allowing comparison of the burden by age group across each socioeconomic area. Age-specific rates of total burden due to suicide and self-inflicted injuries showed a fairly similar pattern by socioeconomic area, being highest among those aged 15-44.
