Changes over time
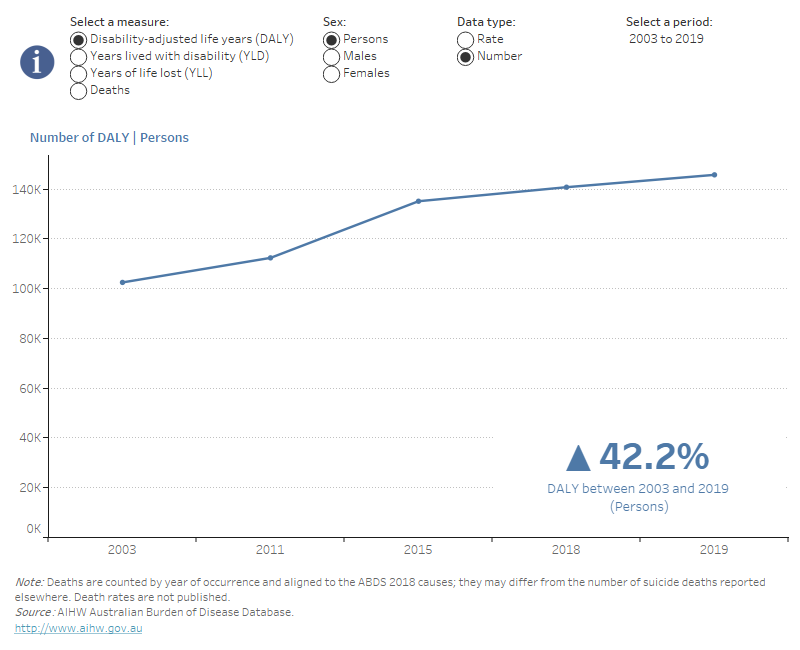
After accounting for population increase and ageing, there was a 13% increase in the overall burden of suicide and self-inflicted injuries between 2003 and 2019, from 5.2 to 5.9 DALY per 1,000 population (Figure 3; Table S3). During this period, the age-standardised rate of fatal burden (YLL) for suicide also increased from 5.2 to 5.8 YLL per 1,000 (13%); however, the age-standardised rate for non-fatal burden (YLD) remained stable.
Females experienced a larger increase in the overall burden of suicide and self-inflicted injuries between 2003 and 2019 (28%) than males (8.7%). Similarly, the increase in fatal burden over this time was higher in females (29%) than in males (8.8%).
Figure 3: Number and age-standardised rate of burden (DALY, YLL, YLD and deaths) due to suicide and self-inflicted injuries, by sex, 2003, 2011, 2015, 2018 and 2019
Figure 3 shows the number and age-standardised rates of burden and the number of deaths by sex in each reference year from 2003 to 2019 by a line chart. A text box at the bottom right highlights the percentage change in the number and age-standardised rates for total, fatal and non-fatal burden between selected years. There was a sharp increase in the rate of total burden between 2003 and 2019 for females.

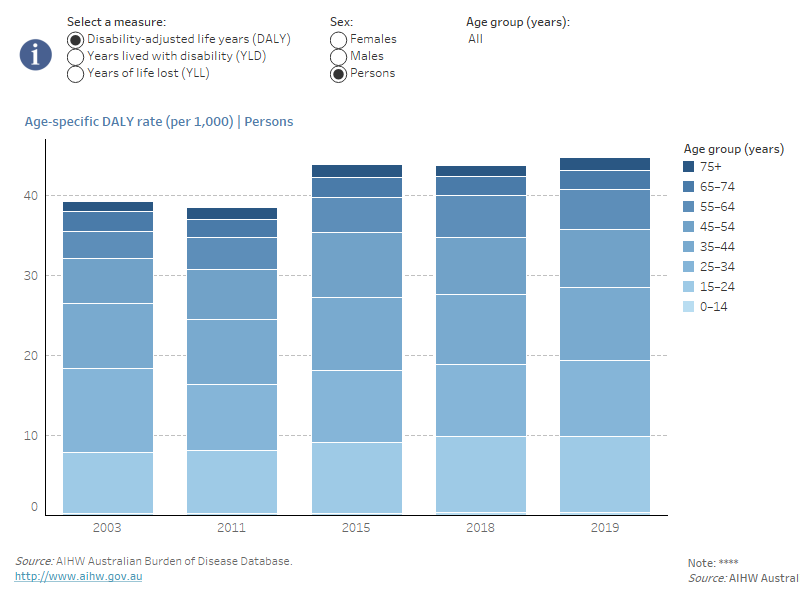
Total burden rates for suicide and self-inflicted injuries increased or remained relatively stable for all age groups between 2003 and 2019. Among females, the largest rate increases occurred in those women aged 75 and over (98%; from 0.44 DALY per 1,000 population in 2003 to 0.87 DALY per 1,000 in 2019) and those aged 15–24 (84%; from 2.8 to 5.1 DALY per 1,000) (Figure 4; Table S4). Among males, those men aged 55–64 experienced the largest increase (56%; from 4.9 to 7.7 DALY per 1,000), followed by men aged 45–54 (32%; from 8.5 to 11.3 DALY per 1,000).
Figure 4: Rate of burden (DALY, YLL and YLD) due to suicide and self‑inflicted injuries, by age group and sex, 2003, 2011, 2015, 2018 and 2019
Figure 4 is a stacked bar chart presenting the age-specific rates of total, fatal and non-fatal burden due to suicide and self-inflicted injuries by sex in each reference year from 2003 to 2019. Total burden rates for suicide and self-inflicted injuries increased or remained relatively stable for all age groups between 2003 and 2019.


