Cancer summary data visualisations
These data visualisations provide a wide range of statistics for many different cancers, describing national cancer data and trends over time for adolescents and young adults (people aged 15–24) in Australia.
Incidence
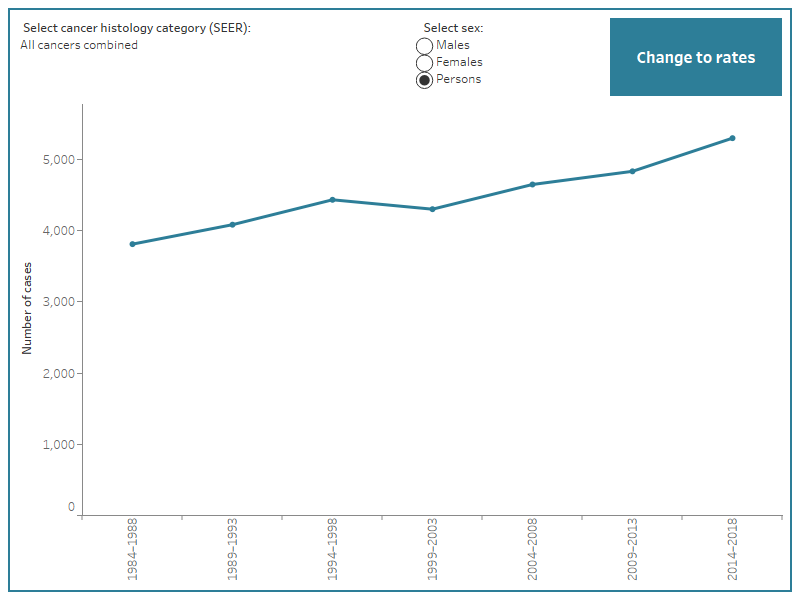
Figure 1 describes new cancer diagnoses of people aged 15–24, in each 5-year period from 1984–1988. Cancers are classified using the revised Surveillance, Epidemiology and End Results (SEER) adolescent and young adult site recode, adjusted to Australian conditions. The SEER adolescent and young adult site recode was developed to describe the major cancers affecting individuals aged 15–39.
The reader can select which cancer and sex to report and can toggle between describing numbers of cases and the rates at which cases are diagnosed. Small numbers of many of the cancers described will result in substantial volatility from year to year. Confidence intervals accompanying the rates will assist the reader in gauging the underlying volatility.
Figure 1: Incidence counts and rates by cancer histology (SEER) and sex, people aged 15–24, 1984–1988 to 2014–2018
This is a line chart that displays incidence counts and rates for adolescents and young adults for 5-year periods. It can be filtered by sex and cancer histology. Overall trends reflect an increase in rates of blood cancers, germ cell and trophoblastic cancers, and carcinomas, and substantial decreases in melanomas.

Note: All data are available in the excel data tables.
Source: Australian Cancer Database 2018.
Survival
Figure 2 describes relative survival for people aged 15–24 diagnosed with cancer in each of the 5-year periods from 1984–1988. Cancers are classified using the revised SEER recode adjusted to Australian conditions. The reader can select which cancer and sex to report, as well as the length of the survival period.
There are some periods for which there is insufficient data to describe survival for some cancers, for one or both sexes. In these cases, some survival estimates may be presented for isolated periods only. If estimates are not available for 5-year relative survival, they may be available for 1-year relative survival. Similarly, if estimates are unavailable for males or females, they may be available for persons. Confidence intervals provide the reader with a sense of the underlying volatility in the data used to calculate these estimates of survival.
Figure 2: Relative survival by cancer histology (SEER) and sex, people aged 15–24, 1984–1988 to 2014–2018
This is a line chart that displays relative survival for adolescents and young adults for 5-year periods. It can be filtered by sex, years since diagnosis and cancer histology. An increase for 5-year relative survival for all cancers combined in adolescents and young adults occurred in persons, males, and females.
Notes
1. Vertical green bars describe the 95% confidence interval for each survival estimate.
2. All data are available in the excel data tables.
Source: Australian Cancer Database 2018.
Mortality
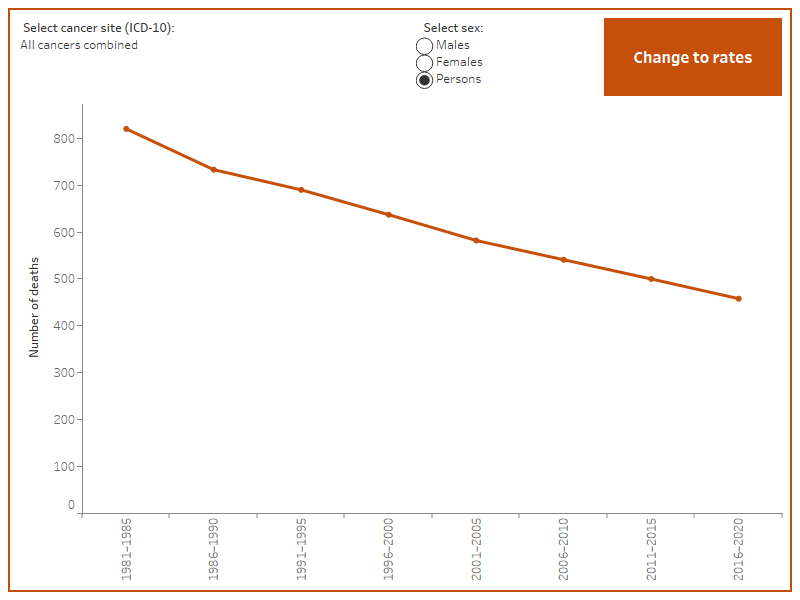
Figure 3 describes cancer mortality for people aged 15–24, including by type of cancer and sex, since 1981. Readers should be cautious; cancers are classified using the ICD-10 classification (rather than the revised SEER recode used in the other figures on this page). The reader can select which cancer and which sex to report and can toggle between describing numbers of deaths and rates of death.
Small numbers of deaths for many of the cancers described will result in substantial volatility from year to year. Confidence intervals accompanying the rates will assist the reader in gauging the underlying volatility.
Figure 3: Mortality counts and rates by cancer site (ICD-10) and sex, people aged 15–24, 1981–1985 to 2016–2020
This is a line chart that displays mortality counts and rates for adolescents and young adults for 5-year periods. It can be filtered by sex and cancer site. A decreasing trend for mortality rates for all cancers combined in adolescents and young adults occurred in persons, males, and females.

Note: All data are available in the excel data tables.
Source: National Mortality Database 2020.
Incidence and mortality comparison
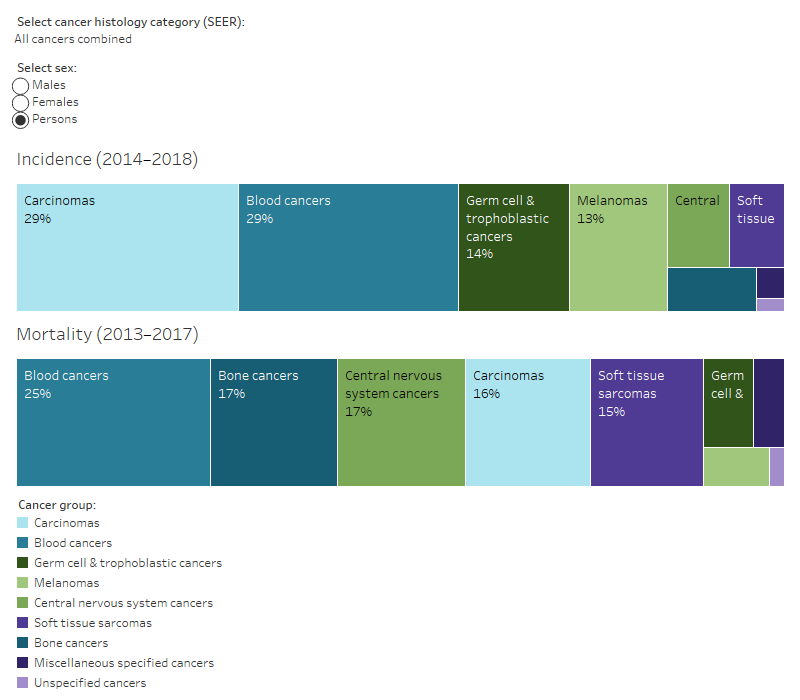
Some cancers are more common than others, and some have better survival rates. For example, while carcinomas are the most common cancer (29% of all cancers) diagnosed in people aged 15–24, they constitute only 16% of all cancer deaths.
Sometimes, relatively common cancers can also have relatively low survival.
Figure 4 describes, for people aged 15–24, the relative incidence of new cases of each type of cancer and compares these with the relative number of deaths due to each type of cancer. Cancers are classified using the revised SEER recode adjusted for the Australian population. The SEER adolescent and young adult site recode was developed to describe the major cancers affecting individuals aged 15–39.
The default settings for the figure below describe incidence and mortality for each of the major cancer groups described in this report.
The figure can be adjusted to describe incidence and mortality for cancer types (for example, types of leukaemia and lymphoma) within each of the broader groups (for example, blood cancers) described in this report, for persons, males, and females.
Figure 4: Cancer proportions by SEER category, people aged 15–24
These are tree maps showing, for people aged 15–24, the proportion of cancer cases and the proportion of cancer deaths, by cancer category. The figure can be filtered by cancer histology and sex. The figure shows that common cancers may not necessarily result in a large number of deaths. For example, in 2014–2018, 29% of all cancer cases in adolescents and young adults were carcinomas however, only 16% of deaths were due to this type of cancer.

Note: All data are available in the excel data tables.
Source: Australian Cancer Database 2018.


