
Children receiving child protection services
If you believe a child is in immediate danger or in a life-threatening situation, call 000.
- If you wish to report a child protection matter, contact the department responsible for child protection in your state or territory.
- See legislation on mandatory reporting and definitions of children 'in need of care and protection' in your state or territory.
On this page
- Overview
- New and repeat clients
- Indigenous children
- Trends in rates of children in the child protection system
- Children in substantiated abuse or neglect cases
- Children on care and protection orders
- Children in out-of-home care
Overview
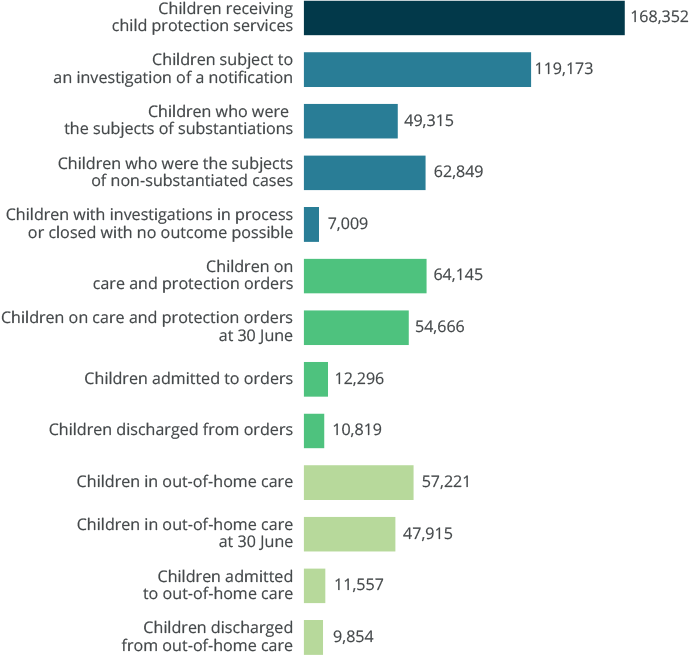
In 2016–17, 168,352 children received child protection services (investigation, care and protection order and/or in out-of-home care)—this was a rate of 30.8 per 1,000 children.
Of children receiving child protection services in 2016–17, 119,173 were the subject of an investigation (21.8 per 1,000), 64,145 were on a care and protection order (11.7 per 1,000) and 57,221 were in out-of-home care (10.5 per 1,000) (Figure 1).
Figure 1: Children receiving child protection services in Australia during 2016–17
Source: Child protection Australia 2016–17 Figure 2.1.
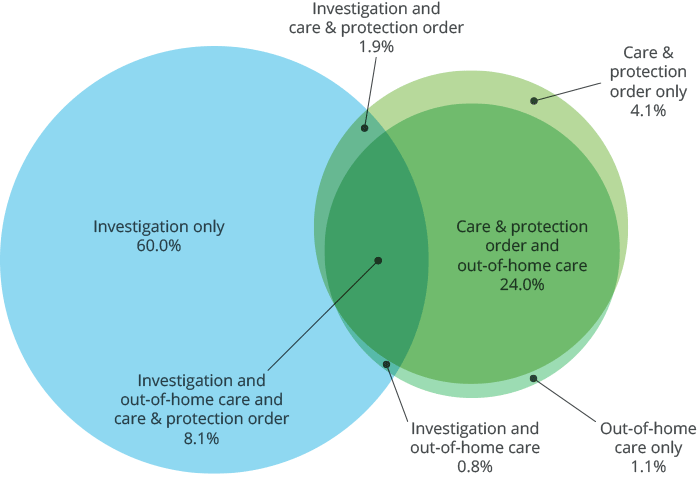
Children may receive a combination of child protection services meaning there are links and overlaps exist between the data collections for notification, investigation and substantiation; care and protection orders; and out-of-home care.
Three-fifths (60%) of children receiving child protection services during 2016–17 were subject only to an investigation (that is, they were not subsequently placed on an order or in out-of-home care) and 8% of children were involved in all 3 components of the system (Figure 2).
Figure 2: Children receiving child protection services by components of service received, 2016–17
Source: Child protection Australia 2016–17 Figure 2.2, Table S1.
New and repeat clients
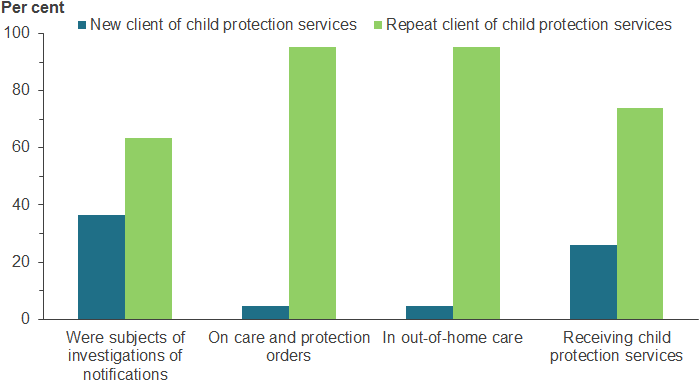
Examining client data provides some insight into whether child protection services are primarily received by new children or those with a prior involvement with child protection, and whether this differs across the system components.
In 2016–17, almost three-quarters (74%) of children receiving child protection services were repeat clients (Figure 3). However, the proportion of repeat clients was substantially higher for those on an order or in out-of-home care (95% for both) compared with those who were the subject of investigations (63%).
Figure 3: Children receiving child protection services by new and repeat client status, 2016–17
Source: Child protection Australia 2016–17 Figure 2.3, Table S2.
Indigenous children
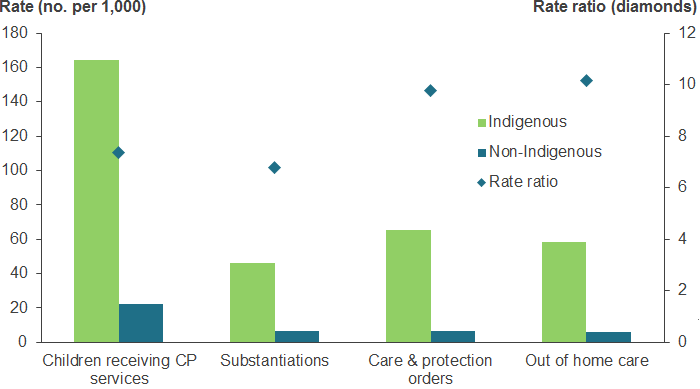
Indigenous children are over-represented across the child protection system compared with non-Indigenous children (Figure 4). In 2016–17, Indigenous children were:
- around 7 times as likely as non-Indigenous children to be receiving child protection services in general or to be the subject of substantiated abuse or neglect;
- around 10 times as likely to be on a care and protection order and
- 10 times as likely to be in out-of-home care.
Figure 4: Children in different components of the child protection system by Indigenous status (rate), 2016–17
Source: Child protection Australia 2016–17 Tables S3, S13, S29, S43
Trends in rates of children in the child protection system
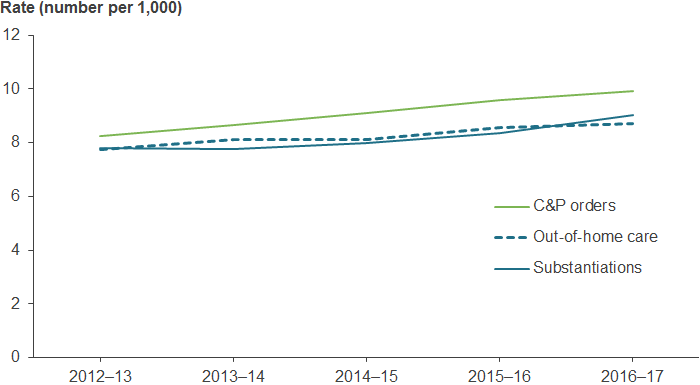
Over the 5 year period between 2012–13 and 2016–17, the rate of children in substantiations, on care and protection orders and in out-of-home care have all increased steadily (Figure 5).
The rate for children on care and protection orders increased from 8.2 per 1,000 children in 2012–13 to 9.9 per 1,000 in 2016–17—a slightly larger increase than for children in substantiations or in out-of-home care.
Figure 5: Children in the child protection system in Australia 2012–13 to 2016–17
Source: Child protection Australia 2016–17 Table S62.
Children in substantiated abuse or neglect cases
In 2016–17 there were 49,315 children in substantiated abuse or neglect cases. This was a rate of 9.0 per 1,000 children aged 0–17 years.
Children aged under 1 were most likely to be the subject of a substantiation (16.4 per 1,000 children) and those aged 15–17 were least likely (4.6 per 1,000 children).
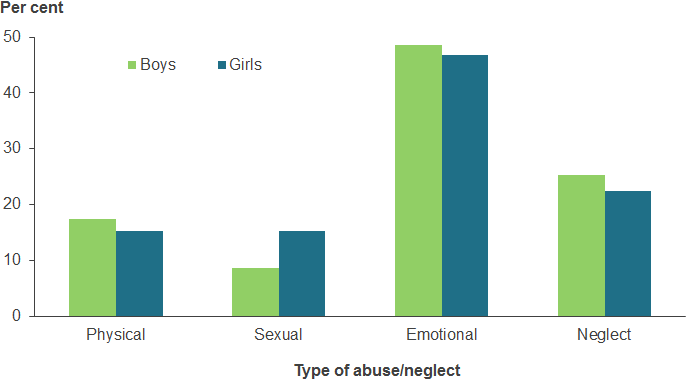
Emotional abuse was the most common substantiated abuse type (48%), followed by neglect (24%) and physical abuse (16%). Sexual abuse was more common among girls; other types of abuse were slightly more common among boys (Figure 6).
Figure 6: Children who were the subjects of substantiations of notifications received during 2016–17, by type of abuse or neglect and sex
Source: Child protection Australia 2016–17 Figure 3.4 and Table S9.
Remoteness and socioeconomic areas
Overall, children from Very remote areas were 4 times as likely as those from Major cities to be the subject of a substantiation (25.4 per 1,000 compared with 6.5 per 1,000) (Figure 7).
 Major cities |
 Inner regional |
 Outer regional |
 Remote |
 Very remote |
|
|---|---|---|---|---|---|
| Rate per 1,000 | 6.5 | 9.7 | 10.7 | 18.0 | 25.4 |
Source: Child protection Australia 2016–17 Figure 3.5 and Table S11.
Of children who were the subject of a substantiation, 35% were from the lowest socioeconomic areas. Indigenous children were more likely to be from the lowest socioeconomic areas—46% compared with 31% for non-Indigenous children (Figure 8).
Figure 8: Children who were the subjects of substantiations, by socioeconomic area at notification, 2016–17

Source: Child protection Australia 2016–17 Figure 3.6, Table S12.
Children on care and protection orders
Across Australia, 64,145 children were on a care and protection order during 2016–17 (approximately 1 in 85 children aged 0–17).
At 30 June 2017, 54,666 (approximately 1 in 100) children aged 0–17 were on a care and protection order. Of these children, almost two-thirds (65% or 35,325) were on finalised guardianship or custody orders.
For further information about children on care and protection orders in 2016–17 who also received specialist homelessness services, see Specialist homelessness services annual report 2016–17.
Children admitted to, and discharged from orders
Over 12,296 children were admitted to orders in 2016–17. Among this group, three-quarters (78%) were admitted to an order for the first time. Children may be admitted (or re-admitted) to a care and protection order for a number of reasons, including substantiated abuse; irretrievable breakdown in the relationship between the child and their parents; or where parents were unwilling and/or unable to adequately care for the child.
In 2016–17,10,819 children were discharged from care and protection orders.
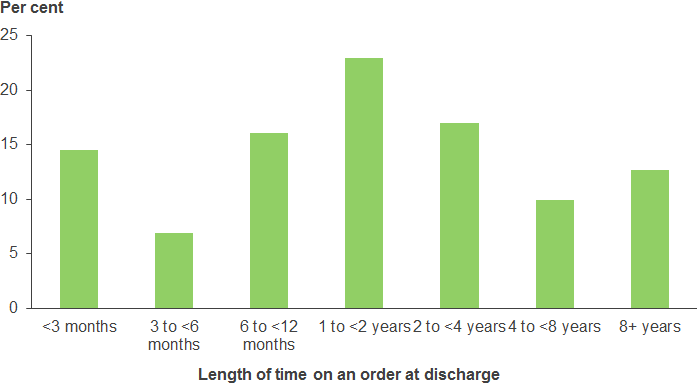
Of these children, 37% had been continuously on an order for less than 12 months; 23% had spent 1 to less than 2 years on an order and 13% had spent 8 years or more (Figure 9).
Figure 9: Children discharged from care and protection orders, by length of time on order, 2016–17
Source: Child protection Australia 2016–17 Figure 4.3, Table S23.
Children in out-of-home care
Nationally, 57,221 children were in out-of-home care during 2016–17 (approximately 1 in 96 children aged 0–17).
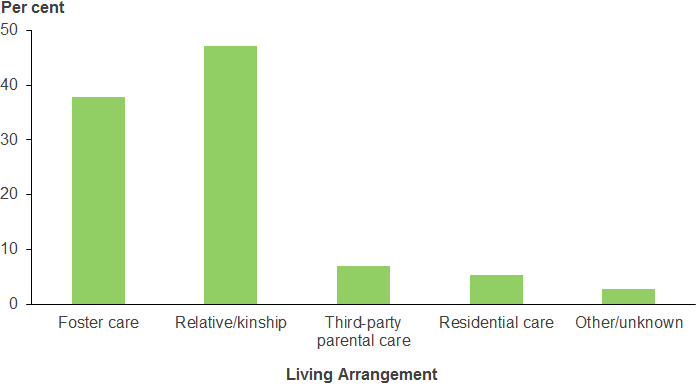
At 30 June 2017, just over 47,915 children were in out-of-home care in Australia. Of these children, 47% were in relative/kinship care, 38% were in foster care, 7% were in third-party parental care and 5% were in residential care (Figure 10).
Figure 10: Children in out-of-home care, by living arrangement, 30 June 2017
Source: Child protection Australia 2016–17 Figure 5.2 , Table S36.
Long-term out-of-home care
Over two-thirds of the 47,915 children in out-of-home care had been in long-term care, that is, for 2 or more years. Of these 32,638 children, 24% lived with a third-party carer who had long-term legal responsibility for them, and for 62%, the state or territory had long-term legal responsibility.
Disability status
Data on the disability status of children in out-of-home care were available for 6 jurisdictions in 2016–17 (representing 71% of children in out-of-home care at 30 June 2017). These data showed that overall, 15% of children in out-of-home care at 30 June 2017 were reported as having a disability.
Remoteness area
Over half (53%) of the children in out-of-home care at 30 June 2017 lived in Major cities and two-fifths (43%) lived in Inner and Outer regional areas. Children living in Remote or Very remote areas were twice as likely as those in Major cities to be in out-of-home care.
Indigenous children living in Major cities were 15 times as likely as non-Indigenous children to be in out-of-home at 30 June—70.4 per 1,000 children, and 4.8 per 1,000 respectively, while Indigenous children living in Remote and Very remote areas were 9 times as likely to be in out-of-home care (see Figure 11).
 Major cities |
  Inner and Outer regional |
  Remote and Very remote |
|
|---|---|---|---|
| Indigenous | 70.4 | 61.1 | 29.8 |
| Non-Indigenous | 4.8 | 8.6 | 3.3 |
Source: Child protection Australia 2016–17 Figure 5.3, Table S42b.
Children admitted to and discharged from out-of-home care
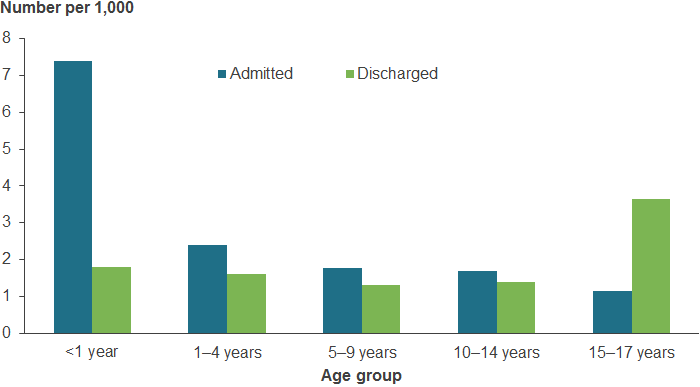
During 2016–17, 11,557 children were admitted to out-of-home care. The rates of admission were higher for younger children and fell as age increased—7.4 per 1,000 for infants (children aged less than 1), and 1.2 per 1,000 for children aged 15–17.
In comparison, rates of discharges from out-of-home care were highest for children aged 15–17 at 3.6 per 1,000. The rates for children discharged from out-of-home care across other age groups were similar, varying from 1.3 per 1,000 for children aged 5–9, to 1.8 per 1,000 for children aged less than 1.
The different age distribution for admissions and discharges reflects children being admitted to out-of-home care at a younger age and remaining there for longer, as well as children leaving out-of-home care once they turn 18.
Figure 12: Children admitted to, and discharged from, out-of-home care, by age group, number per 1,000, 2016–17
Source: Child protection Australia 2016–17 Figure 5.1, Table S34 and S35.