Summary
This report presents statistics on state and territory child protection and family support services, and selected characteristics of children receiving these services. These include statistics for 2017–18, and trends over the 5-year period from 2013–14 to 2017–18.
One in 35 children received child protection services
In 2017–18, about 159,000 children aged 0–17 received child protection services (an investigation, care and protection order or out-of-home care placement). This equates to a rate of 28.7 per 1,000 children.
More than half (56%) of these children were the subject of an investigation only, and were not subsequently placed on a care and protection order or in out-of-home care. A small proportion (7%) of children were involved in all 3 components of the system.
Nearly three quarters (72%) of children receiving child protection services were repeat clients—that is, the children had been the subject of an investigation, care and protection order, and/or out-of-home care placement in a previous financial year.

Indigenous children are over-represented
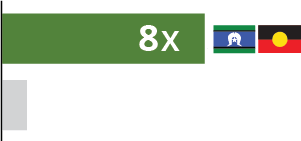
In 2017–18, the rate of Aboriginal and Torres Strait Islander children receiving child protection services was 163.8 per 1,000 Indigenous children, 8 times the rate for non-Indigenous children (19.7 per 1,000).
Rates for children receiving child protection services continue to rise
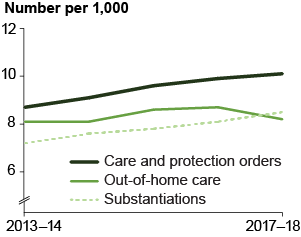
Between 2013–14 and 2017–18, the rates per 1,000 children rose:
- from 7.2 to 8.5 for those who were the subjects of substantiations
- from 8.7 to 10.1 for those on care and protection orders
- from 8.1 to 8.2 for those in out-of-home care (for more information on the comparability of out-of-home care data over time, see Box 1.2).
Emotional abuse is the most common type of abuse or neglect
Emotional abuse (59%) was the most common type of abuse or neglect that was substantiated through investigations. This was followed by neglect (17%), physical abuse (15%), and sexual abuse (9%). Girls (11%) were more likely to be the subject of substantiated sexual abuse than boys (7%), while boys had slightly higher percentages of substantiations for neglect and physical abuse.
Children from remote areas had the highest rates of substantiations
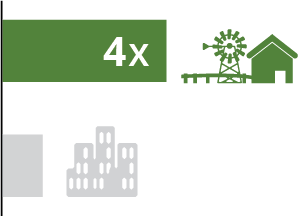
Children from Very remote areas had the highest rates of substantiations (26.1 per 1,000 children) and were 4 times as likely as children from Major cities (7.0 per 1,000) to be the subject of a substantiation.
Half of the children in relative/kinship placements were with grandparents
Half (50%) of children in relative/kinship placements were living with their grandparents, while 23% were placed with an aunt or uncle, and 16% were placed with a non-familial relationship carer.
Of the Indigenous children in out-of-home care, most (65%) were placed with Indigenous relatives/kin, other Indigenous caregivers, or in Indigenous residential care.

About 31,800 children had been in out-of-home care for 2 years or more
At 30 June 2018, of the approximately 31,800 children in long-term (2 years or more) out-of-home care, 73% were under the long-term legal responsibility of the state or territory.
Another 11% of children lived with a third-party carer who had long term legal responsibility for the child.
Of the children in long-term out-of-home care, 2 in 5 (40%) were Indigenous.

-
Introduction
- Child protection overview
- Child protection data components
-
Children receiving child protection services
- Child protection services received
- Characteristics of children receiving child protection services
- National trends
-
Notifications, investigations, and substantiations
- Notifications and investigations
- Substantiations
- National trends
-
Care and protection orders
- Types of orders issued
- Children admitted to, and discharged from, orders
- Children on care and protection orders
- National trends
-
Out-of-home care
- Children admitted to, and discharged from, out-of-home care
- Children in out-of-home care
- National trends
-
Carers
- Foster and relative/kinship carer households
- Household commencements and exits
-
Intensive family support services
- Children commencing services
Appendix A: State/territory trend data
Appendix B: Technical notes
End matter: Acknowledgments; Abbreviations; Glossary; References; List of tables; List of figures


