Impact of COVID-19 on CDM and Medicare-subsidised allied health services
In 2020, the COVID-19 pandemic challenged health systems around the world. The first case in Australia was recorded on 25 January 2020, and new infections around the country have continued to be recorded since that time (AIHW 2020). There have been four waves of COVID-19 in Australia since the start of the pandemic, with two waves occurring in 2020. The first wave occurred from March to April 2020, with cases in all states and territories. The second wave began in the winter of 2020, with most cases in Victoria (AIHW 2022). COVID-19 variants are continuing to emerge, with variants of concern identified by the World Health Organisation as Alpha, Beta, Delta, Gamma and Omicron (Department of Health 2021).
The pandemic has posed a particular challenge for Australians with chronic conditions, who have an increased risk of experiencing severe disease due to their underlying conditions (Department of Health 2020). Public health measures such as staged lockdowns initiated for the protection of the Australian community also indirectly impacted those with chronic conditions, as accessibility and operation of health services underwent significant changes. Even when available, people may have been less inclined to access services due to the perceived risk of COVID-19.
Recognising these direct and indirect impacts, several new or additional services were made available through changes to health service delivery models, policies and programs.
For CDM and Medicare-subsidised allied health services, a series of telehealth services were introduced on the MBS to enable care to continue to be delivered. The telehealth services included options for services to be delivered via telephone or videoconference. These services were introduced from March 2020 and were scheduled to be available until the end of 2021 (Hunt 2021). However, the Department of Health and Aged Care announced that from 1 January 2022 patient access to telehealth services will be supported by ongoing arrangements. The ongoing arrangements build on the temporary telehealth services introduced as part of the Government's response to the COVID-19 pandemic and will continue to enable all Medicare eligible Australians to access telehealth (video and phone) services for a range of (out of hospital) consultations that can also be provided in person (Department of Health 2022)[1].
A full list of item numbers relevant to CDM and Medicare-subsidised allied health services can be found in the Technical notes.
For more information on the COVID-19 pandemic see Australia’s health 2022: data insights.
What are Chronic Disease Management services?
General Practitioner Management Plans (GPMPs) and Team Care Arrangements (TCAs) are Chronic Disease Management (CDM) services available on the Medicare Benefits Schedule (MBS) for people with a chronic or terminal medical condition(s).
A GPMP is a plan of action agreed between a patient and their GP.
TCAs provide Medicare-subsidised care from selected allied health care providers for individual treatment services.
For more information, please see Chronic Disease Management Items.
Given the impact of COVID-19 on health services, data for 2020 are presented separately here.
CDM and Medicare-subsidised allied health telehealth services in 2020
During the COVID-19 pandemic, many medical and allied health practitioners opted to conduct their CDM consultations via telehealth following the introduction of these services in the MBS from March 2020.
Similar to in-person consultations, the Preparation of a GPMP and Coordination of TCAs were the most commonly used CDM telehealth services. From the introduction of the telehealth services on 30 March 2020 to the end of the year, 573,638 patients had a GPMP service and 487,733 patients had a TCA service via telehealth (Table 11a). The Review of GPMP or TCA service was also commonly used, with 427,020 patients accessing 802,521 of these services via telehealth.
A single telehealth item was introduced for the Medicare-subsidised individual allied health services, meaning it is not possible to identify which allied health services were being accessed. From 30 March 2020 to the end of the year, 96,097 patients accessed 149,163 Medicare-subsidised individual allied health services via telehealth. For Medicare-subsidised group allied health services, telehealth services were only introduced for dietetics services (excluding telephone for the group service), with very low use.
|
CDM telehealth services |
Type |
Item numbers |
Number of services |
Number of patients |
|---|---|---|---|---|
|
Preparation of a GP Management Plan (GPMP) |
Telehealth services (videoconference) |
92024, 92055 |
16,744 |
16,697 |
|
Preparation of a GP Management Plan (GPMP) |
Telephone services |
92068, 92099 |
558,437 |
556,941 |
|
Total GPMP telehealth |
|
|
575,181 |
573,638 |
|
Coordination of Team Care Arrangements (TCAs) |
Telehealth services (videoconference) |
92025, 92056 |
13,632 |
13,592 |
|
Coordination of Team Care Arrangements (TCAs) |
Telephone services |
92069, 92100 |
475,278 |
474,141 |
|
Total TCAs telehealth |
|
|
488,910 |
487,733 |
|
Review of a GP Management Plan or Coordination of a Review of Team Care Arrangements |
Telehealth services (videoconference) |
92028, 92059 |
19,959 |
11,871 |
|
Review of a GP Management Plan or Coordination of a Review of Team Care Arrangements |
Telephone services |
92072, 92103 |
782,562 |
415,149 |
|
Total review of GPMP & TCAs telehealth |
|
|
802,521 |
427,020 |
|
Contribution to a Multidisciplinary Care Plan, or to a Review of a Multidisciplinary Care Plan, for a patient who is not a care recipient in a residential aged care facility |
Telehealth services (videoconference) |
92026, 92057 |
357 |
309 |
|
Contribution to a Multidisciplinary Care Plan, or to a Review of a Multidisciplinary Care Plan, for a patient who is not a care recipient in a residential aged care facility |
Telephone services |
92070, 92101 |
4,335 |
3,258 |
|
Total for non-residential aged care telehealth |
|
|
4,692 |
3,567 |
|
Contribution to a Multidisciplinary Care Plan, or to a review of a multidisciplinary care plan, for a resident in an aged care facility |
Telehealth services (videoconference) |
92027, 92058 |
3,828 |
3,020 |
|
Contribution to a Multidisciplinary Care Plan, or to a review of a multidisciplinary care plan, for a resident in an aged care facility |
Telephone services |
92071, 92102 |
7,654 |
6,390 |
|
Total for aged care facility telehealth |
|
|
11,482 |
9,410 |
Note: Totals and subtotals of patients may be less than the sum of each service group as a patient may receive more than one type of service but will be counted only once in the relevant total.
Source: AIHW analysis of MBS data maintained by the Department of Health and Aged Care and sourced from Services Australia.
|
Medicare-subsidised allied health telehealth services |
Type |
Item numbers |
Number of services |
Number of patients |
|---|---|---|---|---|
|
Medicare-subsidised individual allied health services |
Telehealth services (videoconference) |
93000 |
49,114 |
27,426 |
|
Medicare-subsidised individual allied health services |
Telephone services |
93013 |
100,049 |
68,671 |
|
Total Medicare-subsidised individual allied health services telehealth |
|
|
149,163 |
96,097 |
|
Dietetic services- Assessment for group services |
Telehealth services (videoconference) |
93284 |
21 |
21 |
|
Dietetic services- Assessment for group services |
Telephone services |
93286 |
82 |
82 |
|
Total dietetic services-Assessment |
|
|
103 |
103 |
|
Dietetics service-group services |
Telehealth services (videoconference) |
93285 |
50 |
36 |
|
Dietetics service-group services |
Telephone services |
N/A |
N/A |
N/A |
|
Total dietetics service-group services |
|
|
50 |
36 |
1. Services introduced on 30 March 2020.
Note: Totals and subtotals of patients may be less than the sum of each service group as a patient may receive more than one type of service but will be counted only once in the relevant total.
Source: AIHW analysis of MBS data maintained by the Department of Health and Aged Care and sourced from Services Australia.
Telephone was used for most CDM telehealth services (Figures 18–20) (See Data Tables 4.1–4.3).
Figure 18: Month-to-month comparison of the Preparation of a GPMP and Coordination of TCA telehealth services, 2020
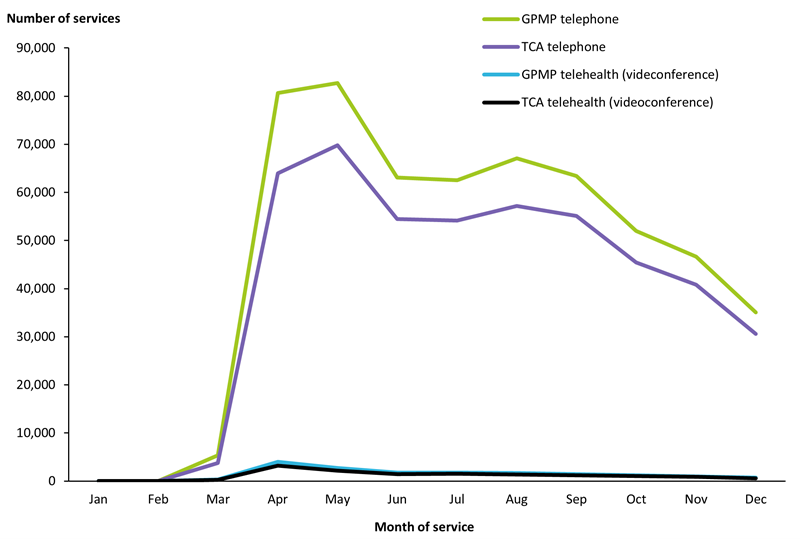
Note: Includes from 20 March 2020 onwards telehealth MBS items: 92024, 92025, 92055, 92056, 92068, 92069, 92099, 92100.
Source: AIHW analysis of MBS data maintained by the Department of Health and Aged Care and sourced from Services Australia (Data Table 4.1).
Figure 19: Month-to-month comparison of the Review of a GPMP or TCA telehealth services, 2020
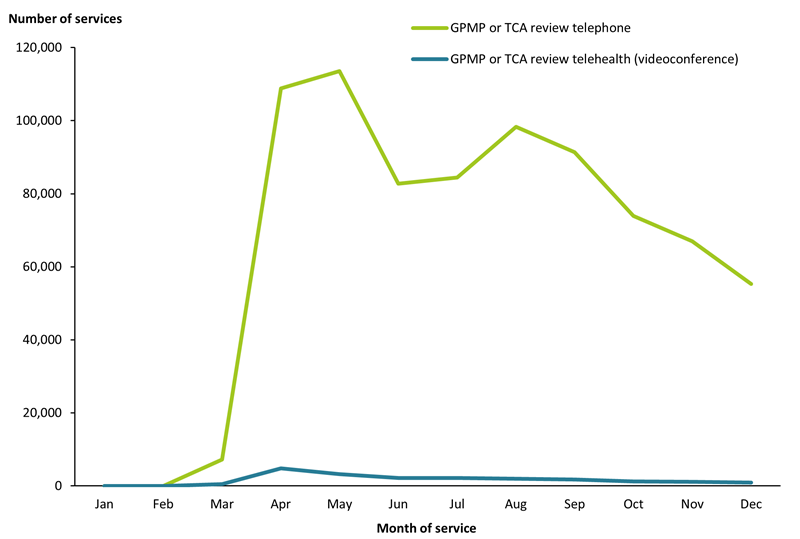
Note: Includes from 20 March onwards 2020 telehealth MBS items: 92028, 92059, 92072, 92103.
Source: AIHW analysis of MBS data maintained by the Department of Health and Aged Care and sourced from Services Australia (Data Table 4.2).
Figure 20: Month-to-month comparison of telephone and videoconference Medicare-subsidised individual allied health telehealth services, 2020
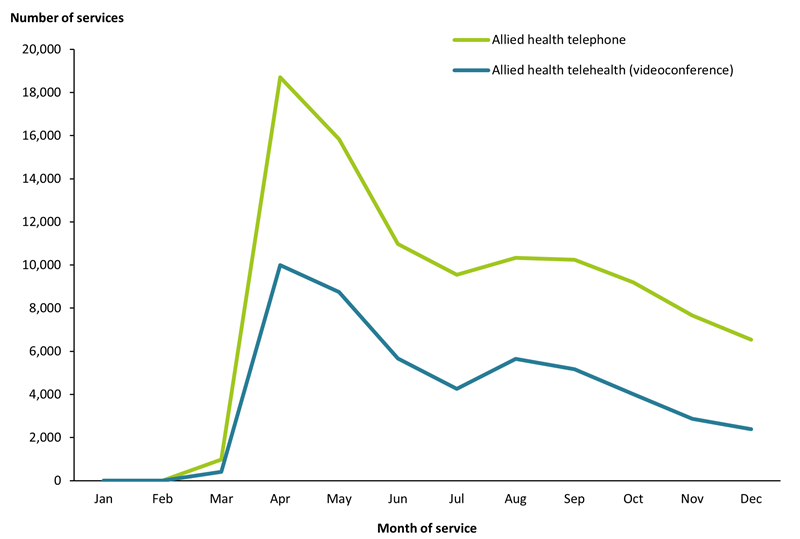
Note: Includes from 20 March 2020 onwards telehealth MBS items: 93000 & 93013.
Source: AIHW analysis of MBS data maintained by the Department of Health and Aged Care and sourced from Services Australia (Data Table 4.3).
Nationally, the introduction of telehealth services had the greatest impact in the months of April and May, during the earlier phase of the national COVID-19 response. For example, they accounted for 1 in 3 GPMP and TCA consultations nationally in those months (Figures 21 and 22). In Victoria, where there was an extended lockdown during a second COVID-19 outbreak later in the year, telehealth accounted for 1 in 2 GPMP and TCA consultations during the months of August and September (See Data Tables 4.4 & 4.5).
The higher number of claims observed in 2020 in comparison to 2019 from June onwards can be attributed to the addition of the telehealth services. Potential reasons include:
- The introduction of telehealth services may have improved access to CDM services, making it easier for the GP to collaborate with other health professionals. This may also have allowed easier collaboration with specialists/other practitioners who may be more suitable for treating that patient, but who reside in other parts of the country.
- Concerns around the potential higher risk of COVID-19 disease for patients with chronic illness may have led practitioners to consider the assessment of these patients during the second half of 2020 as high priority.
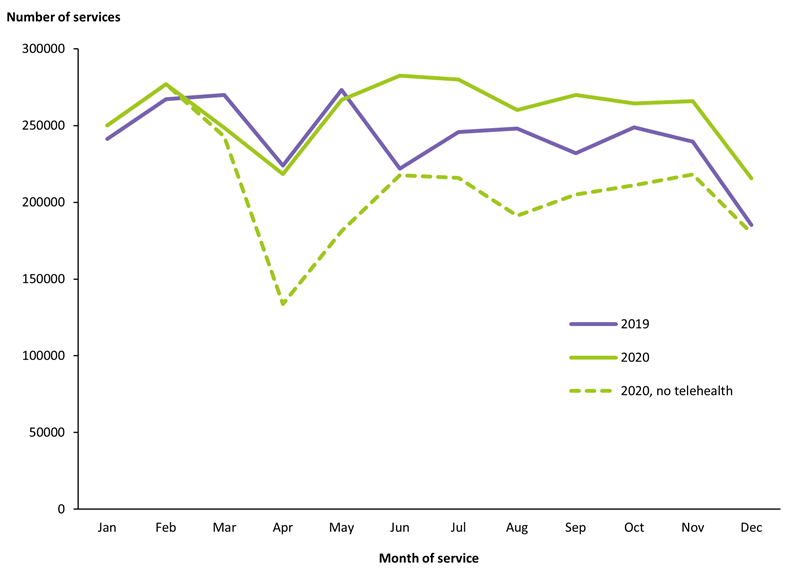
Figure 21: Use of GPMP services by month and year, 2019 and 2020
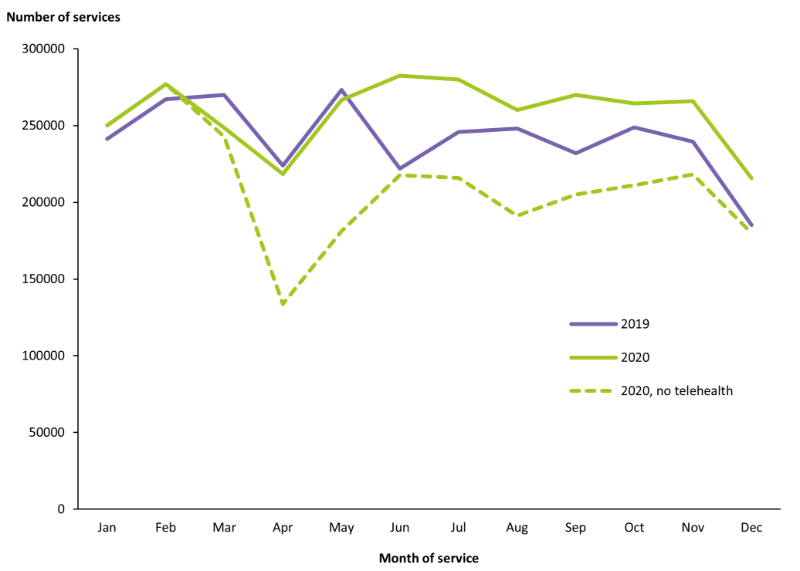
Note: Includes MBS items 721 & 229, and from 30 March 2020 onwards telehealth MBS items 92024, 92055, 92068, 92099 .
Source: AIHW analysis of MBS data maintained by the Department of Health and Aged Care and sourced from Services Australia (Data Table 4.4).
Figure 22: Use of TCA services by month and year, 2019 and 2020
Note: Includes MBS items 723 & 230 from 30 March 2020 onwards and telehealth MBS items 92025, 92056, 92069, 92100.
Source: AIHW analysis of MBS data maintained by the Department of Health and Aged Care and sourced from Services Australia (Data Table 4.5).
Medicare-subsidised allied health services in 2020
As previously stated, all Medicare-subsidised individual allied health services had one single shared telehealth service, introduced on 30 March 2020. However, even without accounting for telehealth services, the top three Medicare-subsidised individual allied health services – podiatry, physiotherapy and chiropractic – all increased or remained stable in 2020 compared to 2019, despite the coronavirus (Figure 23) (See Data Table 4.6).
Figure 23: Use of top Medicare-subsidised individual allied health services by year, 2018 to 2020
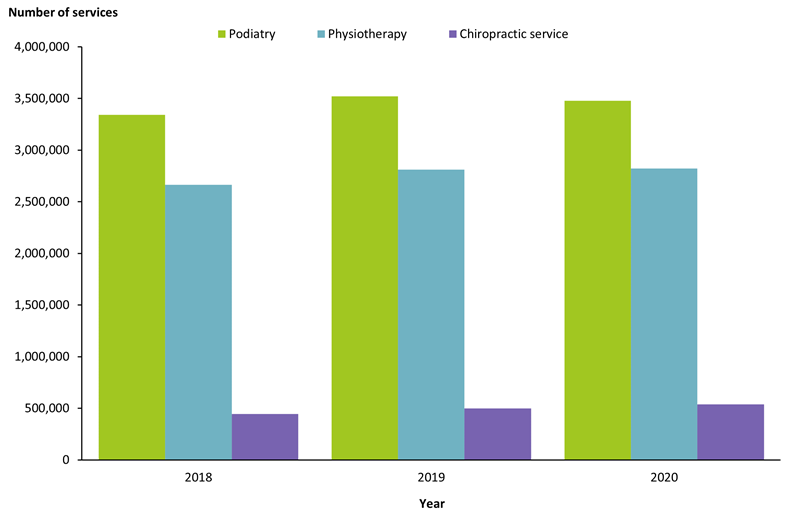
Note: Includes MBS items 10960, 10962 and 10964.
Source: AIHW analysis of MBS data maintained by the Department of Health and Aged Care and sourced from Services Australia (Data Table 4.6).
CDM and Medicare-subsidised allied health telehealth and non-telehealth services in 2020
In 2020, 60% of telehealth CDM and Medicare-subsidised allied health services were provided to females and 40% were provided to males. Non-telehealth CDM and Medicare-subsidised allied health services were split in a similar ratio, with 58% of non-telehealth services provided to females and 42% provide to males in 2020 (See Data Table 4.7).
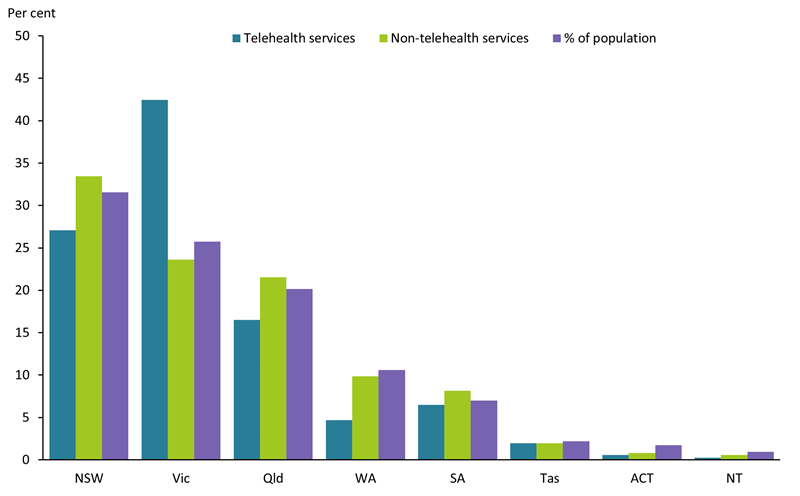
For all CDM/Medicare-subsidised allied health telehealth services Australia-wide, Victoria accessed almost half (42%) in 2020 (Figure 24) (See Data Table 4.8), noting that Victoria was in lockdown for longer than all other states and territories in 2020. By June 2020, COVID-19 restrictions had eased for the time being for most of Australia, however, the greater region of Melbourne was forced into a strict 15-week lockdown between June to October 2020 in response to a second wave of COVID-19 infections in the city.
Figure 24: Use of CDM/Medicare-subsidised allied health telehealth services, by state and territory, 2020
Notes
- 1. Includes MBS items 721, 723, 732, 729, 731, 229, 230, 233, 231, 232, 10997, 10950 to 10970, 81100, 81105, 81110, 81115, 81120, 81125, and from 30 March 2020 onwards telehealth MBS items 92024, 92055, 92025, 92056, 92028, 92059, 92026, 92057, 92027, 92058, 93201, 93000, 93284, 93285, 92068, 92099, 92069, 92100, 92072, 92103, 92070, 92101, 92071, 92102, 93203, 93013, 93286.
- 2. Proportion of the population taken from Australian Bureau of Statistics (ABS) Estimated Resident Population (ERP) as at 30 June 2020, based on the data from the 2016 Census of Population and Housing.
Source: AIHW analysis of MBS data maintained by the Department of Health and Aged Care and sourced from Services Australia (Data Table 4.8).
Fewer older people were using telehealth services, 43% of telehealth services were provided to patients aged 65 years and older as opposed to 52% of in-person consultations (Figure 25) (See Data Table 4.9).
Figure 25: Use of CDM/Medicare-subsidised allied health telehealth services by age-group, 2020
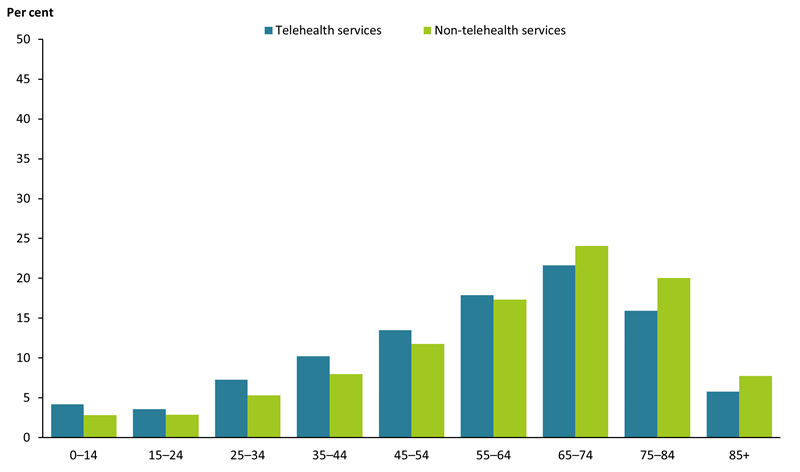
Note: Includes MBS items 721, 723, 732, 729, 731, 229, 230, 233, 231, 232, 10997, 10950 to 10970, 81100, 81105, 81110, 81115, 81120, 81125, and from 30 March 2020 onwards telehealth MBS items 92024, 92055, 92025, 92056, 92028, 92059, 92026, 92057, 92027, 92058, 93201, 93000, 93284, 93285, 92068, 92099, 92069, 92100, 92072, 92103, 92070, 92101, 92071, 92102, 93203, 93013, 93286.
Source: AIHW analysis of MBS data maintained by the Department of Health and Aged Care and sourced from Services Australia (Data Table 4.9).
Comparison of CDM services in 2019 and 2020
A month-to-month comparison of CDM services in 2020 to 2019 (shown in Figures 21 and 22) found that services for Preparation of a GPMP and Coordination of TCAs were lower in March to May 2020 when compared to the respective months in 2019. The greatest difference was observed in March where 21,376 fewer claims for CDM services were made in 2020 compared with 2019. The number of claims was higher in 2020 for all other months when telehealth services were introduced due to the COVID-19 pandemic were included (See Data Tables 4.4 and 4.5)
The difference between the years was greatest in June 2020, where 60,000 more services for the preparation of a GPMP and 52,776 more services for the coordination of TCAs were recorded when compared to June 2019 (Figures 21 and 22). June 2020 was also when the highest number of GPMP services (282,429 services) and TCA services (240,364 services) were provided overall.
The lowest number of GPMP services was recorded in December for both 2020 (215,675 services) and 2019 (185,120 services). For TCA services, the lowest number of services were provided in April 2020 (171,401 services), and December 2019 (152,789 services). Similarly for the CDM review services, the lowest number of services were provided in April 2020 (288,617 services) and December 2019 (264,248) (See Data Table 4.10). This is consistent with seasonal annual claiming patterns, though COVID-19 lockdowns during April and May also may have influenced trends in 2020.
Repeat CDM and Medicare-subsidised allied health services over time
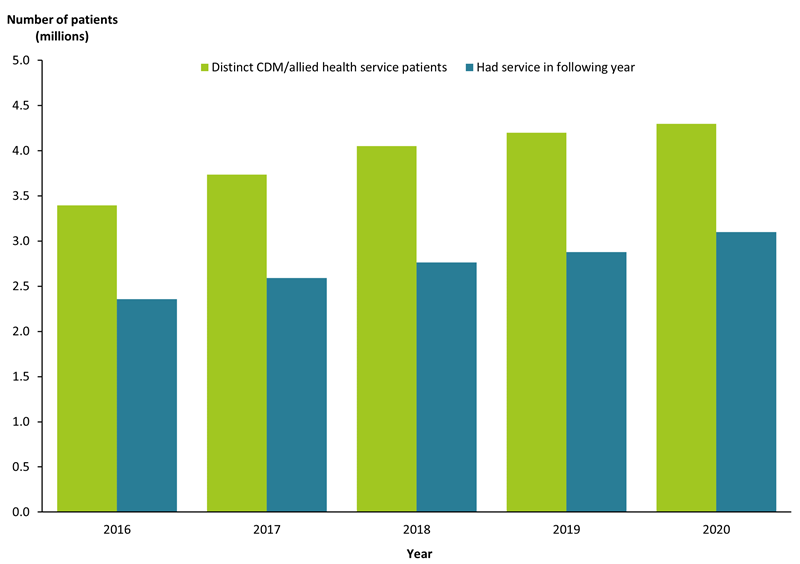
In 2019, 4.2 million patients accessed at least one CDM service or Medicare-subsidised allied health service. More than 2 in 3 (69%) of these patients also accessed at least one CDM service or Medicare-subsidised allied health service in 2020, including the telehealth equivalent services introduced in response to the COVID-19 pandemic.
This is similar to the trend in repeat usage of CDM services and Medicare-subsidised allied health services in the years prior to COVID-19 (Figure 26) (See Data Table 4.11).
There are many reasons why a patient who has previously accessed a CDM service or Medicare-subsidised allied health service may not do so again in the following year. Their condition may have improved, there may have been a disruption to service provision, for example being hospitalised or provider availability issues, or they may have died.
Figure 26: Number of CDM service or Medicare-subsidised allied health service patients who had at least one CDM or Medicare-subsidised allied health service in the following year
Note: Includes MBS items 721, 723, 732, 729, 731, 229, 230, 233, 231, 232, 10997, 10950 to 10970, 81100, 81105, 81110, 81115, 81120, 81125, and from 30 March 2020 onwards telehealth MBS items 92024, 92055, 92025, 92056, 92028, 92059, 92026, 92057, 92027, 92058, 93201, 93000, 93284, 93285, 92068, 92099, 92069, 92100, 92072, 92103, 92070, 92101, 92071, 92102, 93203, 93013, 93286.
Source: AIHW analysis of MBS data maintained by the Department of Health and Aged Care and sourced from Services Australia (Data Table 4.11).
[1] Not all CDM and Medicare-subsidised allied health telehealth were maintained from 1 January 2022, for example MBS items 92072, 92103 (Review of a GP Management Plan or Coordination of a Review of Team Care Arrangements telephone services) are no longer available.