Claiming patterns and use of other Medicare-subsidised services by the CDM population
CDM services and Medicare-subsidised allied health services support people with chronic and terminal medical conditions. However, how these services are used in practice depends on a number of factors, including the specific needs of each patient, their preferences for how they manage their condition and the clinical advice provided by their health practitioner. This section explores patterns around the claiming of CDM services and the use of other Medicare-subsidised services by the CDM population.
Use of review, monitoring and support services
Once a GPMP or TCA is established, it is recommended that the GP regularly review the plan with the patient to ensure it continues to meet their care needs. Other health practitioners working in the practice may also assist the GP to monitor and support a patient’s care. Two specific MBS services that exist to facilitate these review processes are:
- Review of GPMP/TCA (items 732, 233)
- Provision of monitoring and support for a person with a chronic disease by a practice nurse or Aboriginal and Torres Strait Islander health practitioner (referred to as ‘monitoring and support service’; item 10997).
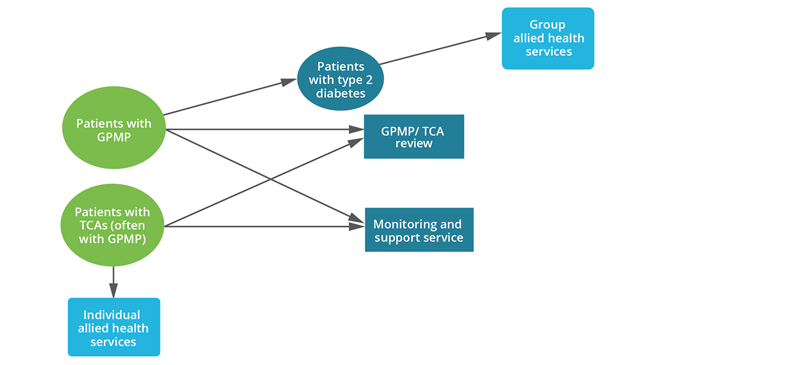
This analysis follows a cohort of 813,174 patients who had a GPMP or TCA established between 1 January 2019 and 30 March 2019, and explores their use of the review and support services for the subsequent 12 months. Figure 13 shows GPMP or TCA patient flows to these services.
Figure 13: GPMP or TCA patient flow to review, monitoring and support services
Review of GPMP and TCAs
To support best practice care, it is expected and strongly encouraged that GPMP and TCAs be regularly reviewed (Department of Health 2014). The recommended period for review is every 6 months, although the minimum claiming period is every 3 months or earlier in exceptional circumstances (Department of Health 2021a). The same item is used for a review of a GPMP or a TCA. If a patient has both a GPMP and TCA, they may have a review service for each plan.
Just under half (47%) of the GPMP/TCA cohort had a review of their plan in the next 12 months. There was some variation in characteristics of patients who did and didn’t have a review:
- Patients who had a review were older, with a median age of 66 compared with 57 for those without a review.
- By state and territory, the highest proportion of GPMP/TCA patients having a review service within the next 12 months was found among those living in South Australia (51%), while the lowest proportion was among those living in Victoria (44%) (See Data Table 3.1).
- The highest proportion of GPMP/TCA patients having a review service within the next 12 months was found among those living in Remote areas (54%), while the lowest proportion was among those living in Major cities (45%) (See Data Table 3.2).
- The proportion of GPMP/TCA patients having a review service was higher for those living in the lowest socioeconomic areas (49%) compared with those in the highest socioeconomic areas (42%) (See Data Table 3.3).
It is important to note that patients may receive similar care to that provided during a review through other MBS services. For example, a patient may have their plan reviewed during a standard consult with their GP, along with discussion or treatment of other issues. It is not possible to quantify how many GPMP/TCA patients have their plans reviewed outside of the specific review service.
Monitoring and support services
This item can be used to provide checks on clinical progress, monitoring medication compliance, self-management advice and/or collection of information between structured care plan reviews with the GP (Department of Health 2021b). This service is provided on behalf of and under the supervision of the patient’s GP and may be claimed up to 5 times per patient per calendar year. This item is relatively well used, with 1.5 million patients claiming 2.6 million services in 2019.
Of the GPMP/TCA cohort, 38% claimed one or more monitoring and support services in the following 12 months. There was some variation in characteristics of patients who did and didn’t use the monitoring and support service:
- Patients who had a monitoring and support service were older, with a median age of 67 compared with 58 for those without a service.
- Patients living in South Australia were the most likely to have a monitoring and support service (61% of the GPMP/TCA cohort), while patients living in the Australian Capital Territory and New South Wales were the least likely (26% and 29% respectively) (See Data Table 3.4).
- A higher proportion of GPMP/TCA patients living in Very remote areas had a monitoring and support service (46%), compared with those living in Major cities (35%) (See Data Table 3.5).
- The proportion of GPMP/TCA patients having a monitoring and support service was higher for those living in the lowest socioeconomic areas (40%) compared with those in the highest socioeconomic areas (31%) (See Data Table 3.6).
Patterns of allied health service use
Patients with a GPMP and TCA are eligible to access up to 5 Medicare-subsidised individual allied health services per calendar year to support the treatment and management of their chronic condition[1]. However, not all patients with a GPMP and TCA will need five allied health services. The patient should be referred for the number of services that will help in the treatment of their condition, up to five will be MBS-subsidised. Of patients who had a Coordination of TCAs service in 2019 (N = 870,333), 35% did not claim any of the Medicare-subsidised individual allied health services. This may be driven by a number of factors, including the patient not requiring allied health services, patient preferences, patient recovery, adherence to GP recommendations or barriers to accessing allied health services.
While the data in this section provides a snapshot of how many people have used Medicare-subsidised individual allied health services in the 2019 calendar year, care should be taken in using these numbers to draw additional inferences about the individuals accessing these services. Because an individual may, for example, have been referred for TCAs towards the end of the year, they may only have had a very limited timeframe to use allied health services in 2019. They may have used 1 individual allied health service in 2019 and then use the remaining 4 services in 2020. These 4 services will count towards the 5 services available in the 2020 calendar year, and patients would need to obtain another referral to access additional individual allied health services. Thus, while these data provide a good overall snapshot, the number of individual allied health services used by an individual may not necessarily be a good representation of the health needs for that particular individual.
Further cohort analysis is required in order to better understand the health circumstances of individuals accessing the Medicare-subsidised individual allied health services.
For more information on Medicare-subsidised allied health services see: Department of Health | Questions and Answers on the Chronic Disease Management (CDM) items.
Some variation was observed between TCA patients who did and did not use individual allied health services.
The proportion of TCA patients who did not use Medicare-subsidised individual allied health services:
- decreased with age: 48% of patients aged 0–14 compared with 23% of patients aged 85 and over (Figure 14)
- varied by state and territory: 64% of TCA patients living in the Northern Territory compared with 26% of patients living in South Australia
- increased with remoteness area: 34% of TCA patients living in Major cities, compared with 81% of TCA patients living in Very remote areas
- was similar across socioeconomic areas.
As previously mentioned, Indigenous Australians have access to the Health Assessment for Aboriginal and Torres Strait Islander People (MBS Item 715, 228) and follow-up allied health services (MBS Items 81300 to 81360). These items provide an alternative referral pathway for Aboriginal or Torres Strait Islander people to access allied health services.
Note: See Data tables 3.7, 3.8, 3.9, 3.10.
It is important to note that the above analysis investigated Medicare-subsidised individual allied health services use in those who had TCAs in the 2019 calendar year. However, patients continue to be eligible for rebates for allied health services while they are being managed under a GPMP and TCAs as long as the need for services continues to be recommended in their plan – they do not need a new GPMP and TCA each calendar year. Therefore, this analysis does not represent all eligible patients who did not claim any Medicare-subsidised individual allied health services in the 2019 year.
Other considerations include:
- It is not possible to identify patients who had been referred for individual allied health services previously but no longer need them.
- It is not possible to identify when a new referral for allied health services is given because these referrals can be provided during a review of a GPMP and TCAs or during a standard GP consultation.
- There is no identifiable end date for a GPMP and TCAs.
Cohort analysis identifying when patients first received a GPMP and TCAs is required to gain a holistic view of those who did and did not claim allied health services.
For more information on Medicare-subsidised allied health services see: Department of Health | Questions and Answers on the Chronic Disease Management (CDM) items.
Figure 14: Proportion of TCA patients who did not claim any Medicare-subsidised individual allied health services, by age group, 2019
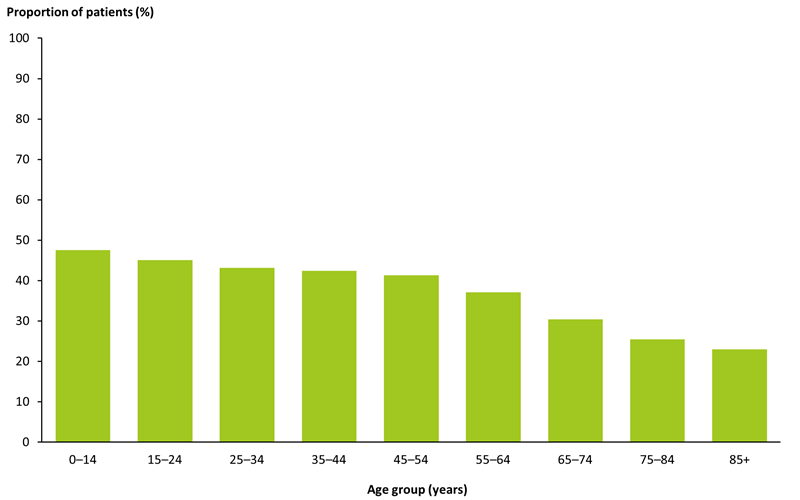
Note: Includes MBS items: 723 & 230.
Source: AIHW analysis of MBS data maintained by the Department of Health and Aged Care and sourced from Services Australia (Data Table 3.7).
Of patients who did use Medicare-subsidised individual allied health services in 2019 (N = 2,412,608), 37% claimed all 5 available services (Figure 15) (See Data table 3.12). Depending on their care needs, some patients may not have been referred for 5 allied health services. It is not possible to identify how many services a GP has recommended for a patient from the Medicare-subsidised data. Some patients may have been referred for more services than they used but did not access their full entitlement of services. This may be due to similar factors mentioned above: patient preferences, adherence to GP recommendations or barriers to accessing allied health services.
Figure 15: Utilisation of Medicare-subsidised individual allied health services among allied health patients, 2019
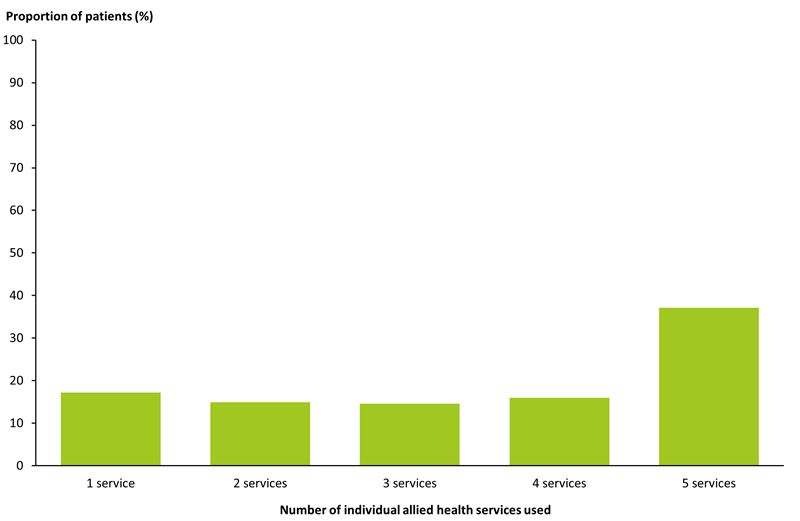
Note: Includes MBS items: 10950, 10951, 10952, 10953, 10954, 10956, 10958, 10960, 10962, 10964, 10966, 10968, 10970.
Source: AIHW analysis of MBS data maintained by the Department of Health and Aged Care and sourced from Services Australia (Data Table 3.12).
Some variation was observed between patients using Medicare-subsidised individual allied health services who used their full entitlement of services and those who did not:
- Using more services is generally associated with increasing age. Those aged 75–84 had the highest proportion of patients using 5 services (46%), followed by patients aged 85 and over (45%) (See Data Table 3.11).
- However, use of all 5 services was also somewhat common in the youngest age group: 32% of patients aged 0–14 years compared with 24% of patients aged 15–24.
- The number of services used decreased with increasing remoteness (Figure 16) (See Data Table 3.13).
- The number of services used did not vary by socioeconomic area (See Data Table 3.14).
Figure 16: Utilisation of Medicare-subsidised individual allied health services among allied health patients, by remoteness area, 2019
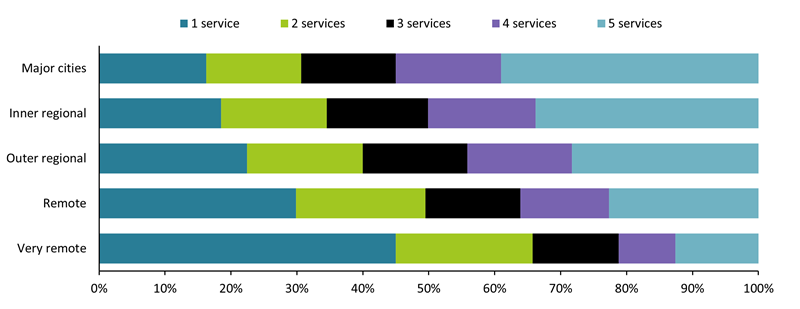
Note: Includes MBS items: 10950, 10951, 10952, 10953, 10954, 10956, 10958, 10960, 10962, 10964, 10966, 10968, 10970.
Source: AIHW analysis of MBS data maintained by the Department of Health and Aged Care and sourced from Services Australia (Data Table 3.13).
The observed variation in the use of all 5 individual allied health services according to remoteness area may indicate that there is a lack of access to these services in outer regional and remote communities. There is a higher prevalence of allied health professions in major cities compared to remote and very remote areas (National Rural Health Alliance 2019). When examining the allied health workforce by Modified Monash (MM) Model areas, the highest rate of full-time equivalent physiotherapists, psychologists, occupational therapists and optometrists per 100,000 population are located in the major cities, with this number decreasing as remoteness increases (Department of Health 2021c).
The variation may also be linked to affordability. In 2019–20, those living in greater capital city areas had higher median weekly income compared with the rest of the state ($1,001 compared with $881, respectively) and a higher median net household worth ($613,000 compared with $523,000, respectively) (ABS 2022). The Medicare rebate freeze on allied health services[1], lifted on 1 July 2019, may have also had an impact on affordability of allied health services in rural and remote areas.
Use of other MBS services
People with chronic conditions are likely to use a greater number of health services than those without. This analysis explores selected other MBS services used in 2019 by patients who had a Preparation of GPMP or Coordination of TCAs service in the same year (N = 2,891,201 and N = 2,458,750, respectively). Figure 17 shows potential GPMP or TCA patient flows to other MBS services.
Figure 17: GPMP or TCA patient flow to other MBS services
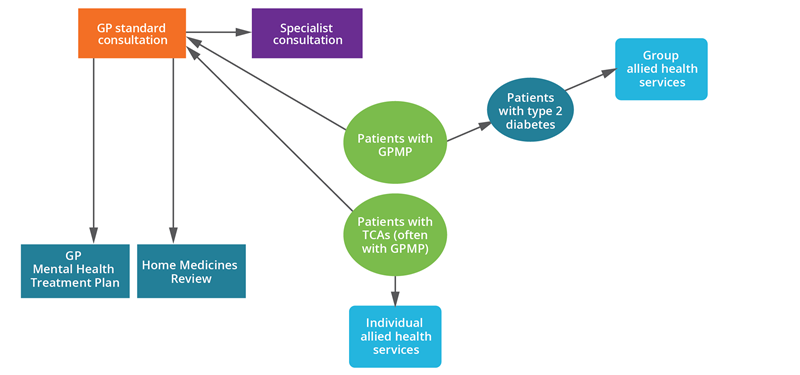
Almost all (98%) GPMP/TCA patients had a standard GP consultation in 2019. The proportion of patients visiting a specialist was slightly higher for the TCA cohort (61%) compared with patients in the GPMP cohort (59%). For both cohorts, the most common specialist visit was for anaesthesia, followed by cardiology, ophthalmology and general surgery (Table 9). A small proportion of patients accessed other specialised GP services, including the GP Mental Health Treatment Plan, Diabetes cycle of care, Asthma cycle of care and Home Medicine Review.
|
MBS service type |
Number of GPMP patients |
Proportion of GPMP patients (%) |
Number of TCA patients |
Proportion of TCAs patients (%) |
|---|---|---|---|---|
|
GP standard consultation |
2,817,902 |
97.5 |
2,401,406 |
97.7 |
|
Specialist |
1,705,607 |
59.0 |
1,489,648 |
60.6 |
|
- Anaesthesia |
437,255 |
25.6 |
384,495 |
25.8 |
|
- Cardiology |
409,811 |
24.0 |
359,791 |
24.2 |
|
- Ophthalmology |
377,025 |
22.1 |
333,147 |
22.4 |
|
- General surgery |
256,474 |
15.0 |
224,143 |
15.0 |
|
GP Mental Health Treatment Plan |
249,533 |
8.6 |
221,561 |
9.0 |
|
Asthma cycle of care |
19,862 |
0.7 |
14,479 |
0.6 |
|
Diabetes cycle of care |
151,214 |
5.2 |
139,024 |
5.7 |
|
Home Medicines Review2 |
49,848 |
1.7 |
46,568 |
1.9 |
|
- DMMR |
43,897 |
88.1 |
40,981 |
88.0 |
|
- RMMR |
5,951 |
11.9 |
5,587 |
12.0 |
Notes
- Data are reported by the time period in which the service was provided. Includes services with a date of service between 1 January and 31 December 2019.
- DMMR: Domiciliary Medication Management Review (items: 245, 900); RMMR: Residential Medication Management Review (items: 249, 903)
Source: AIHW analysis of MBS data maintained by the Department of Health and Aged Care and sourced from Services Australia.
While one-third (34%) of GPMP/TCA patients had at least 1 GP standard consultation during 2019, a further third (34–35%) had more than 3 consultations in the year. More than two-thirds (68%) of patients in both cohorts visited a specialist once in 2019, with frequent specialist visits less common than GP consultations (Table 10).
|
Speciality type |
1 visit (%) |
2 visits (%) |
3 visits (%) |
More than 3 visits (%) |
|---|---|---|---|---|
|
GPMP patients |
34.3 |
19.2 |
12.4 |
34.2 |
|
GPMP patients |
68.4 |
18.5 |
6.2 |
6.9 |
|
TCA patients |
33.9 |
19.0 |
12.3 |
34.8 |
|
TCA patients |
68.1 |
18.6 |
6.3 |
7.0 |
Note: Data are reported by the time period in which the service was provided. Includes services with a date of service between 1 January and 31 December 2019.
Source: AIHW analysis of MBS data maintained by the Department of Health and Aged Care and sourced from Services Australia.
[1] A medicare rebate is available for a maximum of five individual allied health services per patient per calendar year. More services in a calendar year are not available under any circumstances.