Trends in Medicare-subsidised allied health service use
This bar chart shows how many patients, claimed allied health services from 2010 to 2020, and is calculated as a rate per 1000 population. The graph shows a steady increase in patients till 2019 and a slight decrease in 2020.

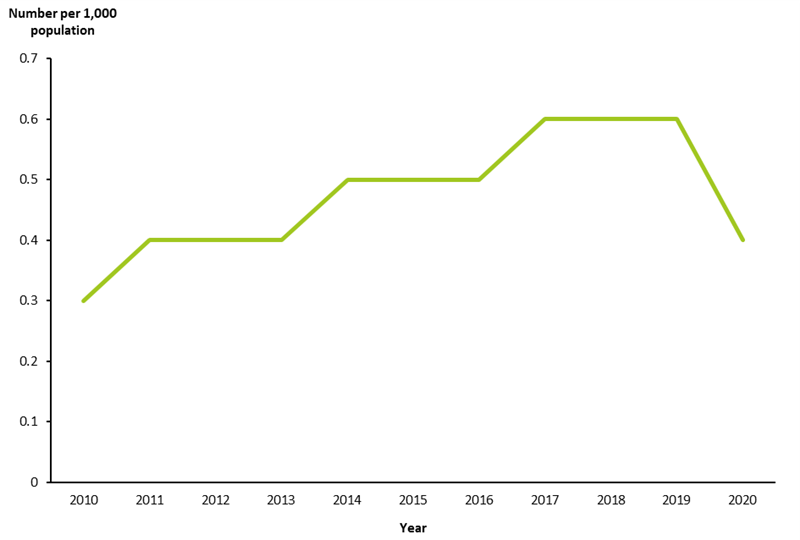
The use of group allied health services has generally increased over time from 2010 to 2019, with a degree of fluctuation (Figure 12). The rate of patients using group services dropped between 2019 and 2020; see Impact of COVID-19 on CDM and allied health services for further analysis of 2020 activity.
Figure 12: Patients who claimed group allied health services (per 1,000 population), 2010 to 2020
Notes
- Age-standardised to the 2001 Australian standard population.
- Includes MBS items: 81100, 81105, 81110, 81115, 81120, 81125.
Source: AIHW analysis of MBS data maintained by the Department of Health and Aged Care and sourced from Services Australia (Data Table 2.5).