Profile of chronic disease management patients
Claiming patterns of chronic disease management (CDM) services vary by demographic characteristics, jurisdiction, remoteness and socioeconomic areas. This section focuses on patients who had a Preparation of a GPMP or a Coordination of TCA service in 2019, as the two most highly used CDM services.
Age and sex
The rate of patients claiming for both GPMP and TCAs services was higher for females than males: (GPMP: 113 vs 96 per 1,000 population, TCAs: 97 vs 80 per 1,000 population). For both services, rates were highest among patients aged 75–84. Some differences were noted by age and sex. Rates increased with age until 75–84 then dropped. For all age groups, except for boys aged 0–14 and males aged 85 years and over, rates were higher for females than males (Figures 2 and 3).
Figure 2: Patients who had a GPMP service (per 1,000 population), by age and sex, 2019
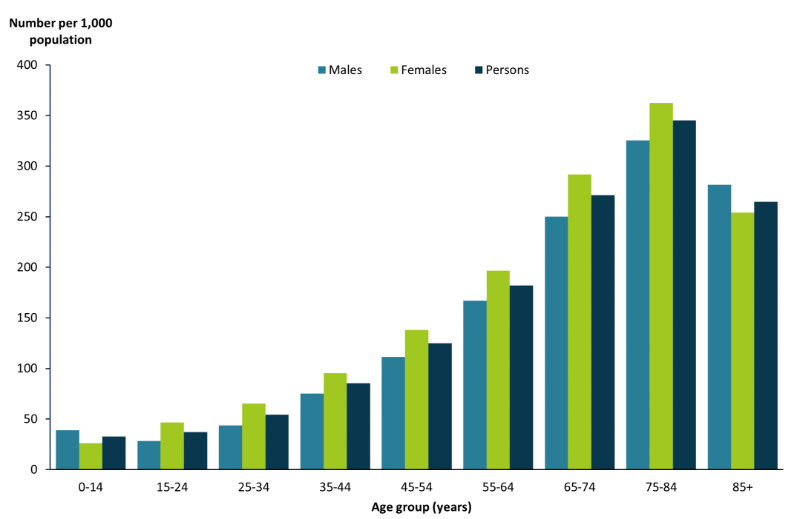
Note: Includes MBS items 721 and 229.
Source: AIHW analysis of MBS data maintained by the Department of Health and Aged Care and sourced from Services Australia (data table 1.1).
Figure 3: Patients who had a TCA service (per 1,000 population), by age and sex, 2019
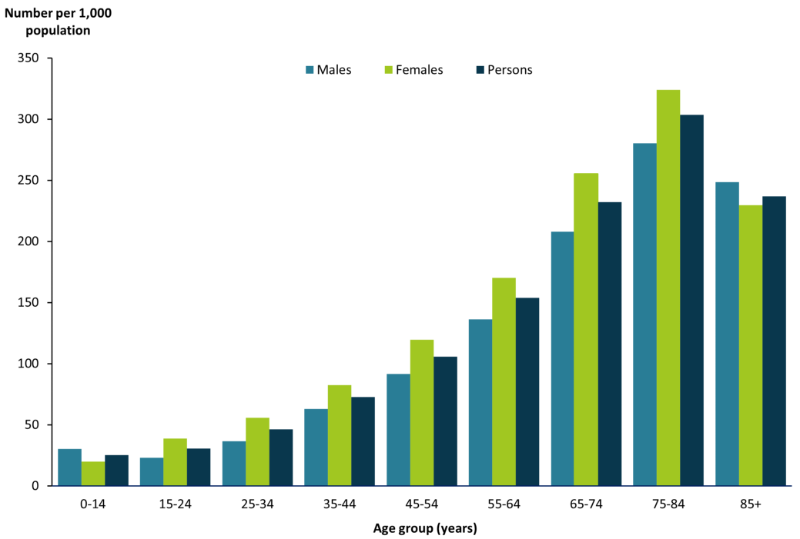
Note: Includes MBS items: 723 and 230.
Source: AIHW analysis of MBS data maintained by the Department of Health and Aged Care and sourced from Services Australia (data table 1.2).
State and territory
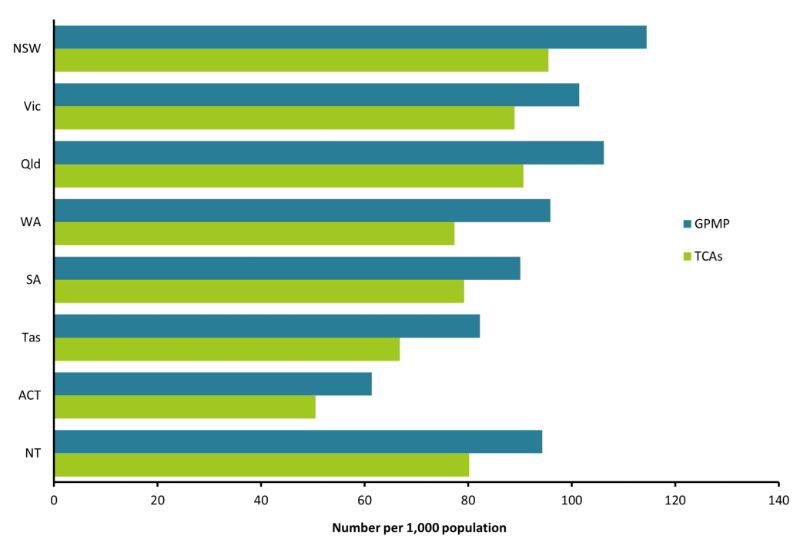
The rate of patients claiming for GPMP services was higher than TCAs in all states and territories (Figure 4). For both services, New South Wales had the highest rates (GPMP: 115 per 1,000 population, TCAs: 96 per 1,000 population) and the Australian Capital Territory the lowest (GPMP: 61 per 1,000 population, TCAs: 51 per 1,000 population), after adjusting for differences in age structure.
Figure 4: Patients who had a GPMP or TCA service (per 1,000 population), by state and territory, 2019
Notes
- Age-standardised to the 2001 Australian standard population.
- Includes MBS items: 721, 723, 229 and 230.
Source: AIHW analysis of MBS data maintained by the Department of Health and Aged Care and sourced from Services Australia (data table 1.3).
Remoteness area
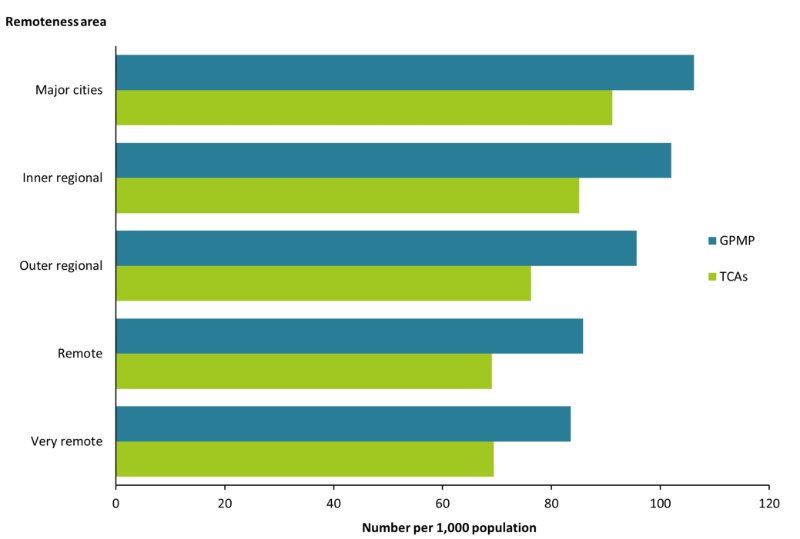
For GPMP services, the rate of patients claiming was higher in Major cities (106 per 1,000 population), followed by Inner regional areas (102 per 1,000 population). Patients claiming TCAs were higher for Major cities (91 per 1,000 population), followed by Inner regional areas (85 per 1,000 population) after adjusting for differences in the age structure between remoteness areas (Figure 5).
It is important to note that along with the CDM services, Indigenous Australians have access to the Health Assessment for Aboriginal and Torres Strait Islander People (MBS Item 715, 228) and follow-up allied health services (MBS Items 81300 to 81360, also available with a Health Care Home shared plan). These services provide an alternative referral pathway for Aboriginal or Torres Strait Islander people to access allied health services.
Figure 5: Patients who had a GPMP or TCA service (per 1,000 population), by remoteness area, 2019
Notes
- Age-standardised to the 2001 Australian standard population.
- Includes MBS items: 721, 723, 229 and 230.
- Remoteness is classified according to the Australian Statistical Geography Standard (ASGS) 2016 Remoteness Areas structure based on area of residence.
Source: AIHW analysis of MBS data maintained by the Department of Health and Aged Care and sourced from Services Australia (data table 1.5).
Socioeconomic area
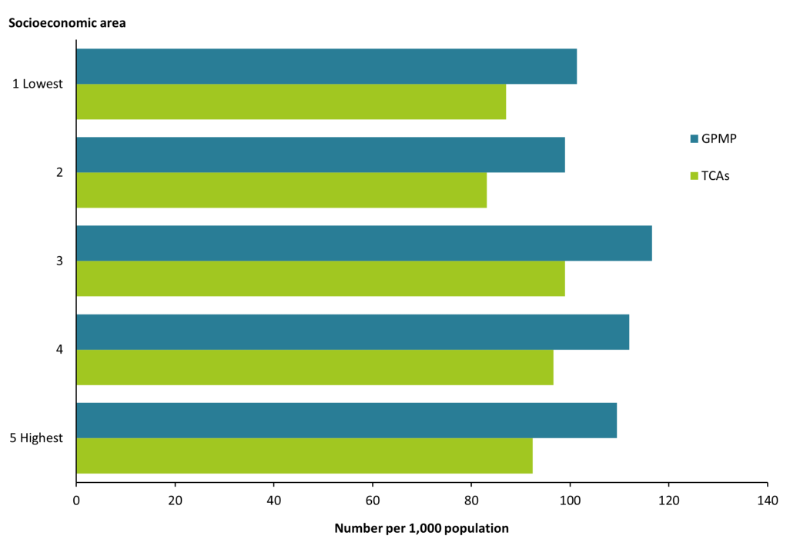
The rate of patients claiming GPMP services was generally higher among patients living in the highest socioeconomic areas (109 per 1,000 population) compared with the lowest socioeconomic areas (101 per 1,000 population), after adjusting for age (Figure 6). A similar pattern was noted in the claiming patterns by socioeconomic areas for TCAs services (92 per 1,000 population for highest compared with 87 per 1,000 for lowest socioeconomic areas).
Chronic conditions tend to be more prevalent in areas with higher levels of disadvantage (see National Health Survey: First results, 2017-18 financial year | Australian Bureau of Statistics). These findings could indicate that people from different socioeconomic areas are accessing health care for chronic conditions in different ways. For example, those with greater levels of advantage may have better access to GPs, while those with greater levels of disadvantage may be seeking treatment from outpatient and community health services.
Figure 6: Patients who had a GPMP or TCA service (per 1,000 population), by socioeconomic area, 2019
Notes
- Age-standardised to the 2001 Australian standard population.
- Includes MBS items: 721, 723, 229 and 230.
- Socioeconomic areas are classified according to the Index of Relative Socio-Economic Disadvantage (IRSD) based on area of residence defined by the ABS as of 30 June 2016.
Source: AIHW analysis of MBS data maintained by the Department of Health and Aged Care and sourced from Services Australia (data table 1.5).
Geography
After adjusting for age, variation in the use of GPMP and TCAs was found across areas when examining by Primary Health Networks (PHNs) and Statistical Area Level 3 (SA3).
Variation by Primary Health Network (PHN) areas
After adjusting for age, the 3 PHN areas with highest rates of GPMP item use were: North Coast (NSW) (145 per 1,000 population), Western Sydney (NSW) (141 per 1,000 population) and South Western Sydney (NSW) (133 per 1,000) (See Figure 7). The 3 PHN areas with the lowest rates of GPMP item use were: Country SA (SA) (80 per 1,000 population), Gippsland (Qld) (73 per 1,000 population) and Australian Capital Territory (ACT) (63 per 1,000 population) (see data table 1.6).
For TCAs services, the 3 PHN areas with the highest rates of item use were: North Coast (NSW) (123 per 1,000 population), Western Sydney (NSW) (119 per 1,000 population), and South Western Sydney (NSW) (115 per 1,000 population) (See Figure 7). The 3 PHN areas with the lowest rate of TCAs item use were: Tasmania (Tas) (69 per 1,000 population), Gippsland (Qld) (63 per 1,000 population), and Australian Capital Territory (ACT) (51 per 1,000 population) (see data table 1.6).
Variation by Statistical Area Level 3 (SA3)
After adjusting for age, the 3 SA3 areas with the highest rates of GPMP item use were: Port Macquarie (NSW) (181 per 1,000 population); Tumut – Tumbarumba (NSW) (165 per 1,000 population) and Bathurst (NSW) (163 per 1,000 population each) (See Figure 7). The 3 SA3 areas with the lowest rates of GPMP item use were: South Canberra (ACT) (36 per 1,000 population), Esperance (WA) and Manjimup (WA) (29 and 15 per 1,000 population respectively) (see data table 1.7).
For TCAs, the 3 SA3 areas with the highest rates of item use were: Canberra East (ACT) (521 per 1,000 population), Beaudesert (Qld) (224 per 1,000 population), and Barkly (NT) (212 per 1,000 population) (See Figure 7). The 3 SA3 areas with the lowest rates of TCA item use were: Esperance (WA) (35 per 1,000 population), Woden Valley (ACT) (34 per 1,000 population), and Manjimup (WA) (20 per 1,000 population) (see data table 1.7).
Figure 7: Distribution of GPMP and TCA services (per 1,000 population) by PHN and SA3, 2019 (navigation to map pages)
For the best experience to view the interactive map use Chrome, Edge or Firefox browsers. For more information on browser compatibility, see Supported browsers
