Profile of Medicare-subsidised allied health service users
Claiming patterns of the three most used Medicare-subsidised individual allied health services varied by demographic characteristics, jurisdiction, remoteness and socioeconomic areas.
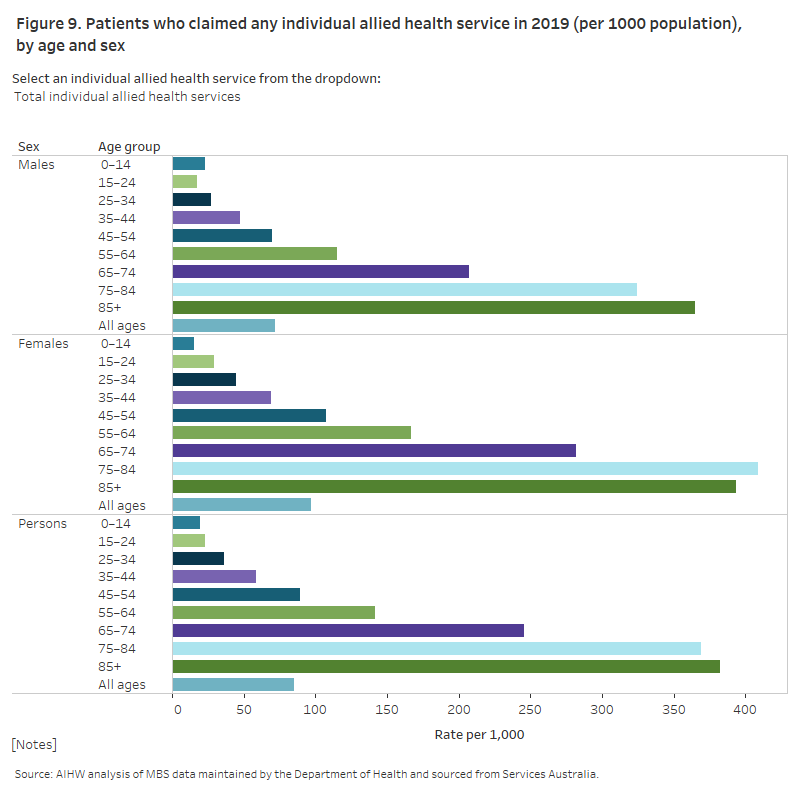
Figures 9 and 10 contain demographic information for selected Medicare-subsidised individual allied health services. Key findings from the top 3 most used services include (See Data Tables 2.1, 2.2 and 2.3):
Podiatry
The rate of the patients claiming this service was:
- Higher for females than males (41 females compared with 33 males per 1,000 population), after adjusting for age.
- Higher in patients aged 65 and over. For females compared with males, the difference was greater in almost all age groups (excluding those aged 0 to 14).
- Higher in Major cities and Inner regional areas (38 per 1,000 population) compared with Very remote areas (8.4 per 1,000 population), after adjusting for age.
- Slightly higher in the lowest socioeconomic areas (38 per 1,000 population), compared with the highest socioeconomic areas (36 per 1,000 population), after adjusting for age.
Physiotherapy
The rate of the patients claiming this service was:
- Higher for females than males (39 females compared with 25 males per 1,000 population), after adjusting for age.
- Highest among patients aged 75–84. Some differences were noted by age and sex. Rates increased with age until 75–84 then dropped, for males and females (with the exception of females aged 75–84). Rates were highest for females aged 65–74 (108 per 1,000 population) and males aged 75–84 (75 per 1,000 population).
- Higher in Major cities compared with Very remote areas (35 compared with 6.4 per 1,000 population), after adjusting for age.
- Higher in the highest socioeconomic areas (35 per 1,000 population), compared with the lowest socioeconomic areas (30 per 1,000 population), after adjusting for age.
Dietetics
The rate of patients claiming this service was:
- Higher for females (12 per 1,000 population) than males (7.9 per 1,000) and was highest for people aged 65–74 (20 per 1,000 population).
- Higher in Major cities and Inner regional areas (10 per 1,000 population) compared with Very remote areas (2.7 per 1,000 population), after adjusting for age.
- Minimal differences were noted by socioeconomic area, after adjusting for age.
It is important to note that the variation in claiming observed for these three allied health services by remoteness area may be influenced by geographical variation in the prevalence of chronic conditions. For more information on some of these chronic conditions see: Geographical variation in disease: diabetes, cardiovascular and chronic kidney disease, Type 2 diabetes dashboards.
This bar chart shows how many patients, age group-wise and sex- wise, claimed selected allied health services in 2019, and is calculated as a rate per 1000 population. The graph shows that patients aged 75 years and above claim he highest individual allied health service in 2019.

This bar chart shows how many patients, demographic characteristics- wise, claimed allied health services in 2019, and is calculated as a rate per 1000 population. The graph shows that patients in major cities claim the highest individual allied health service in 2019 and patients living in relatively higher socioeconomic areas claim the highest individual allied health service in 2019.

Note: See Data Tables 2.1, 2.2, 2.3 for details.
Examination of all Medicare-subsidised allied health services by geographical location can be found here: Medicare-subsidised GP, allied health and specialist health care across local areas: 2019–20 to 2020–21.


