Inside
- From the Director
- Board Chair welcomes new AIHW Director
- NHPA functions have moved to the AIHW—an exciting future for local level health reporting
- Australia's health 2016—We're a mostly healthy bunch, but we have room to improve
- A sophisticated analysis of Australia's disease burden
- Health spending linked with both population factors and wealth growth
- First-of-its-kind report provides a clearer picture of homelessness and family violence
- New opportunities: MBS and PBS data now at AIHW
- Risk factors and chronic disease: reduce one, avoid many
- Back to the source: returning data to Indigenous communities
- Children in out-of-home care: their perspectives
- Powerful insights from linked data
- Social media at the AIHW
- new releases
From the Director
Welcome to this edition of Access magazine, the Institute's 40th—and my first since being appointed AIHW Director, making it a particularly special one for me!
I'd like to take this opportunity to thank our previous Acting Directors—Kerry Flanagan and more recently, Andrew Kettle—for their hard work, commitment and leadership over the last two years.
Reading this issue of Access, you'll probably notice we are again returning to the theme of 'change'. This is no accident: for the past two years, change has been a constant at the AIHW.
As well as the changes in leadership, over the last two years the AIHW has moved to new premises, started a program of cultural change and innovation, and welcomed new colleagues from the (now decommissioned) National Health Performance Authority (NHPA). You'll read more about this later in this magazine.
We've also seen changes in the types of work we do. In addition to the integration of NHPA's Health Performance Framework reporting functions, we've been busy working behind the scenes to secure Medicare Benefits Schedule (MBS) and Pharmaceutical Benefits Scheme (PBS) data, as well as continuing our work on data linkage. You'll find more information about these projects in this issue.
While the AIHW is undergoing rapid changes, in many ways, it's business as usual. We continue to produce a range of significant reports and updates, including the latest edition of Australia's health, which you'll find profiled in this issue.
Other features include the much-anticipated report Australian Burden of Disease Study: impact and causes of illness and death in Australia 2011, the first-of-its-kind analysis found in Domestic and family violence and homelessness 2011–12 to 2013–14, and the long-term insights provided by 25 years of health expenditure in Australia: 1989–90 to 2013–14.
By providing independent and authoritative health and welfare information and statistics, we not only inform policy and service delivery considerations, but contribute to the health and wellbeing of all Australians. I consider that all of us in the Institute have an opportunity (and a challenge) to build on the significant existing capabilities to further the use of data-driven evidence to respond to key health and welfare issues facing Australia.
I am enormously pleased to be a part of this and have already heard numerous great ideas in discussions with staff and stakeholders of the Institute. Our work is highly valued by a wide range of stakeholders and I hope you enjoy exploring some of it in this issue of Access.

Barry Sandison
Director (CEO), AIHW
Board Chair welcomes new AIHW Director
At the 23 June Board meeting, the Chairman of the Board of the AIHW, Dr Mukesh C Haikerwal AO, along with the other Board members, welcomed the appointment of Mr Barry Sandison as the new Director of the AIIHW.
Dr Haikerwal said, 'Barry Sandison brings a wealth of experience to the AIHW, joining the Institute from the Department of Human Services where he held the role of Deputy Secretary, Health and Information. His knowledge and experience are both broad and deep, with over 30 years in the public sector in more than a dozen agencies including Employment and Workplace Relations and Commonwealth Families Housing Community Services and Indigenous Affairs.'
'The Board and I are looking forward to working with Mr Sandison to steer a significant program of change for the AIHW, which will enhance current work and practices built on the solid, well-earned reputation for ethical and respectful engagement with stakeholders and on the quality and standard of our work.'
Dr Haikerwal thanked the management and staff of the AIHW for continuing to produce reports of an excellent standard on a wide range of health and welfare subjects that have informed meaningful discussions about Australia's health and welfare for nearly 30 years.
Mr Sandison started work as the Director (CEO) of the AIHW on 20 June 2016.
The AIHW Board is currently comprised of the following members:
- Mr Barry Sandison
- Ms Luise McCulloch
- Mr Paul Madden
- Dr Lyn Roberts AO
- Dr Erin Lalor
- Mr Michael Perusco
- Mr Andrew Goodsall
- Mr David Conry
- Mr Philip Fagan-Schmidt
- Ms Marilyn Chilvers
- Dr Zoran Bolevich.

Dr Mukesh C Haikerwal AO
Board Chair, AIHW
NHPA functions have moved to the AIHW—an exciting future for local level health reporting

In late 2015, the Government announced its decision to close the National Health Performance Authority (NHPA) from 1 July 2016, with its activities and many of its staff transferring to the AIHW.
AIHW Director and CEO Barry Sandison said it was an exciting time for the Institute.
'AIHW and NPHA have shared a long, productive relationship, with many commonalities, in both our objectives and work.
'But it's not just a case of amalgamating similar organisations. Joining the two agencies' skills and resources presents a great opportunity for more comprehensive whole-of-health-system reporting—and in turn, well-informed decision making,' Mr Sandison said.
The transition expands the AIHW's analysis and reporting functions to include reporting against the COAG-agreed Performance and Accountability Framework (PAF).
'From 1 July, the AIHW significantly expanded its reporting on local level health data—including at the Primary Health Network and individual hospital level,' Mr Sandison said.
'We gain from NHPA's expertise in these areas, and are looking forward to expanding our geospatial analysis, reporting and presentation.'
The AIHW, which originally developed the MyHospitals website, again takes carriage of its management, and of the MyHealthyCommunities website.
In the lead-up to the closure of the NHPA, the AIHW worked closely with Chief Executive Officer, Dr Diane Watson, and her NHPA colleagues to ensure a smooth transition.
'Both agencies have worked hard to ensure there was no disruption to PAF reporting, and that future work remains consistent with the requirements of the nine governments that agreed to the PAF,' Mr Sandison said.
'I'd like to extend my thanks to Dr Watson for her excellent work and support through the process.'
Former NHPA staff who have transferred to AIHW form the new Health Performance and Accountability Framework Group, working in Sydney and Canberra. The Group is headed by Mr Michael Frost who brings a wealth of experience to the role, having held the position of Executive Director, Strategic Initiatives at the NHPA.
'I'm excited for this new chapter for the AIHW, and am very much looking forward to the release of a range of new PAF reporting products through the AIHW, MyHospitals and MyHealthyCommunities websites,' Mr Sandison said.
Australia’s health 2016—We’re a mostly healthy bunch, but we have room to improve
Australia has much to be proud of in many areas of health, according to the latest health report card delivered by the AIHW.
However, Australia's health 2016, the AIHW's 15th biennial health report, also shows that lifestyle-related chronic diseases continue to take a toll.
The report was launched in Canberra in September by the Hon. Sussan Ley, Minister for Health and Aged Care, Minister for Sport.
AIHW Director and CEO Barry Sandison said, 'On the positive side, our report shows that we have increasingly longer life expectancy, lower death rates for cancer and many other diseases, and 85% of us say that we are in good or excellent health.'
Life expectancy, the 'universal health indicator', places Australia among the top nations in the world-sixth for women and eighth for men—but very close to the first-placed nations in 2013 (Switzerland for males, Japan for females).
'We are living 25 years longer on average than a century ago—a boy born today can expect to live to 80.3 years, and a girl to 84.4 years,' Mr Sandison said.
Despite an increase in the absolute number of deaths, there has been a long and continuing fall in death rates in Australia. From 1907 to 2013, the age-standardised death rates for males and females fell by 71% and 76% respectively.
'However, we also see that Australians are increasingly living with chronic diseases, which typically are long-lasting and have persistent effects.'
Chronic diseases, such as cancer, cardiovascular disease, chronic obstructive pulmonary disease (COPD) and diabetes, are the leading cause of illness, disability and death in Australia. In 2013, eight selected chronic diseases (arthritis, asthma, back pain and problems, cancer, cardiovascular disease, COPD, diabetes, and mental health conditions) accounted for 73% of all deaths.
The report also looks at the risk factors shared by many chronic diseases. Many of these common risk factors are preventable, such as smoking, physical inactivity, poor nutrition and the harmful use of alcohol.
'These risk factors can lead to overweight and obesity, high blood pressure, and high cholesterol, which in turn can lead to cardiovascular disease, diabetes, cancer and mental health issues,' Mr Sandison said.
The report shows that, in Australia, more than 3 in 5 adults (63%) are overweight or obese. Nearly 1 in 2 (45%) do not exercise enough for health benefits, and in 2014–15, only 7% of adults were eating the recommended daily serves of vegetables and 50% were eating enough fruit.
We are doing well, but could do better
Australia has achieved great success in reducing smoking rates among young people and adults.
'From 2001–2013, the proportion of young people aged 15–24 who had never smoked rose from 65% to 81%,' Mr Sandison said.
'But while daily smoking rates are low by world standards, at 13% for adults, people in Remote/Very remote areas were twice as likely to smoke daily compared with those in Major cities, showing that improvements can still be made.'
The report also shows that while cancer survival is improving, cancer accounts for the biggest disease burden in Australia.
Five-year relative survival for all cancers combined improved from 40% to 66% for males and from 52% to 68% from 1982–1986 to 2007–2011. Among people surviving 5 years past their cancer diagnosis, in 2007-2011, the chance of surviving at least another 5 years was 91%.
However, for the first time, the total number of deaths due to all types of cancer combined (44,100) surpassed the total number of deaths due to all cardiovascular diseases (which includes coronary heart disease, stroke and heart failure) (43,600).
Cancer contributed 19% of the total burden of disease in Australia in 2011, and combined with cardiovascular diseases; mental and substance-use disorders; musculoskeletal disorders; and injury accounted for around two-thirds of the total burden (69% for males, 62% for females).
Mr Sandison said that while the majority of young Australians had good mental health, in 2013–14, 1 in 7 (14% or 560,000) children and adolescents aged 4–17 had a mental disorder in the previous 12 months.
'At some point in their lives, 13% of Australians aged 16–85 have experienced suicidal thoughts and 3.3% have attempted suicide. From 2004 to 2013, an average of 2,300 Australians died by suicide each year.'
Health is not the same for everyone
While there have been some improvements in the health of Aboriginal and Torres Strait Islander people in recent years, Australia's health 2016 reports that there is still a significant health gap between Indigenous and non-Indigenous Australians. Indigenous males live, on average, 10.6 fewer years than non-indigenous males and for females the gap is 9.5 years. Despite significant improvements in infant and child mortality over the past 2 decades, Indigenous children aged under 5 died at twice the rate of non-Indigenous children in 2014.
People living in rural and remote areas and people living in lower socioeconomic areas can also face health inequalities.
'Rural Australians often travel greater distances to seek medical attention, and generally have higher rates of ill health and mortality than people living in urban areas,' Mr Sandison said.
People living in the lowest socioeconomic areas are more likely to have poor health and to have higher rates of illness, disability and death than people who live in the highest socioeconomic areas.
'If all Australians had the same death rates as the 20% of Australians living in the highest socioeconomic area, there would have been about 54,200 fewer deaths in 2009–2011,' Mr Sandison said.
A sophisticated analysis of Australia’s disease burden
In May this year, the AIHW released its much-anticipated report, Australian Burden of Disease Study: impact and causes of illness and death in Australia 2011. This report, the third national Australian Burden of Disease Study, updates previous estimates of Australia's disease burden.
'Burden of disease analysis is a way to compare the impact of different diseases, conditions or injuries on a population, including both the fatal and non-fatal impacts,' said Dr Lynelle Moon, co-author and Acting Head of the Institute's Health Group.
These studies also estimate how much of the burden can be attributed to various risk factors. 'Overall, this study provides a comprehensive and sophisticated picture of Australians' health,' Dr Moon said.
This information supports health service planning, particularly when responding to the increased burden associated with chronic disease.
'There is also significant potential for extension analyses, including scenario modelling of various policy options and relating it to disease expenditure data.'
Most burden is caused by chronic disease—and much of the burden is preventable
The five disease groups that caused the most burden were cancer, cardiovascular diseases, mental and substance use disorders, musculoskeletal conditions and injuries. Together, these accounted for 66% of the total burden.
Coronary heart disease, back pain and problems, chronic obstructive pulmonary disease and lung cancer, as the leading specific diseases, contributed 18% of the total burden.
The study also shows that around one-third of the burden of disease in 2011 was preventable, being due to the modifiable risk factors included in this study.
'The risk factors causing the most burden were tobacco use, high body weight, alcohol use, physical inactivity and high blood pressure,' Dr Moon said.
Analysis of all dietary risk factors included in the study suggested that they accounted for 7% of disease burden (Table 1).
Almost a decade of improved population health—but not everyone is doing so well
Between 2003 and 2011 there was a 10% fall in total burden—that is, the fatal and non-fatal components combined—after accounting for population increase and ageing.
'This was mainly due to a 15% fall in fatal burden.'
Among all the disease groups, the largest fall in the fatal burden was seen in cardiovascular diseases, where rates fell by nearly one-third.
There was also a fall of 4% in non-fatal burden during the period.
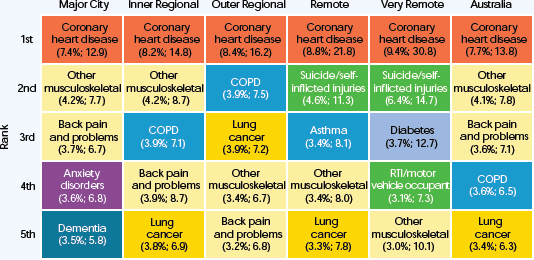
Despite these improvements, the study highlights large inequalities across socioeconomic groups and remoteness areas (Figure 1).
'We found that 21% of overall burden could be attributed to inequalities across socioeconomic groups, and 4% could be attributed to inequalities across remoteness areas,' Dr Moon said.
Table 1: Proportion (%) of burden attributable to the leading risk factors, for selected disease groups, 2011
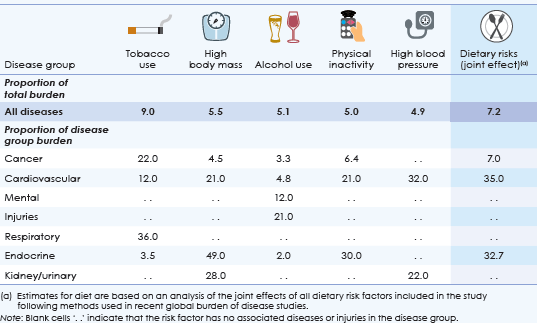
Figure 1: Leading causes of total burden (proportion %; age-standardised DALY rate per 1,000 people), by remoteness, 2011
View Australian Burden of Disease Study: Impact and causes of illness and death in Australia 2011.
For more information about the study, including methods, detailed data tables and video summaries see Burden of disease.
Health spending linked with both population factors and wealth growth
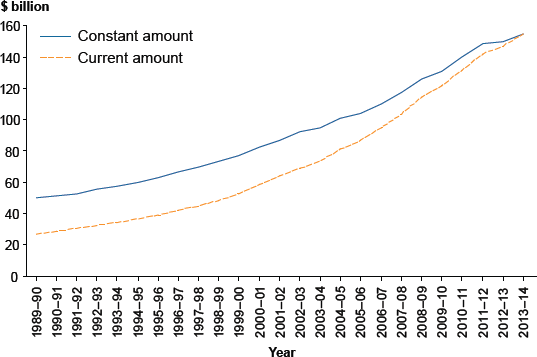
The last 25 years in Australia was a period marked by a growing, ageing population, a growing economy, significant improvements in medical technologies and treatments and increased spending on health.
The AIHW report, 25 years of health expenditure in Australia: 1989–90 to 2013–14, shows that health spending rose by more than $100 billion (207%) over the period 1989–90 to 2013–14-from $50.3 billion (6.5% of gross domestic product, or GDP) to $154.6 billion (9.7% of GDP), adjusted for inflation (Figure 1).
Figure 1: Expenditure on health, current and constant prices, 1989–90 to 2013–14
Government spending and revenue
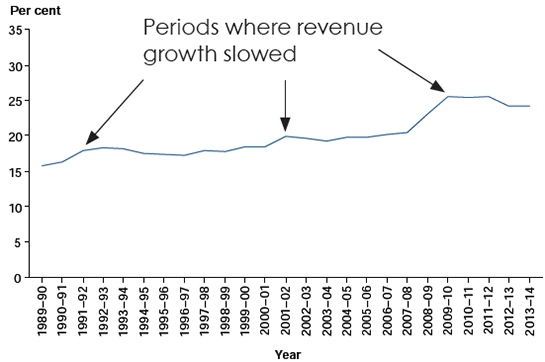
'About 68% of health spending is funded by governments, so it is worth exploring the relationship between government revenue and health spending,' Dr Webster said.
'Both government health expenditure and taxation revenue rose over the 25 year period but there were particular periods when growth in government spending was greater than growth in taxation revenue,' Dr Webster said.
This was mostly during periods of relatively slow revenue growth—for example, following the global financial crisis that commenced in 2008–09 (Figure 2).
Figure 2: Government health expenditure as a proportion of taxation revenue, current prices, 1989–90 to 2013–14
Spending by individuals
Around one-third of health expenditure (32%) comes from non-government sources—ultimately individuals.
Non-government health spending tended to keep pace with growth in individual net worth (assets less liabilities) over the period, although it grew faster than average incomes.
'These findings suggest that the economy plays a role in health expenditure alongside population and other factors,' said Dr Webster.
A link between wealth and health expenditure has been found in other countries. The OECD noted that increasing wealth tends to correlate with increasing health expenditure and that, following the global financial crisis, health spending slowed in many countries.
First-of-its-kind report provides a clearer picture of homelessness and family violence
A recent AIHW report provides new insights into the relationship between domestic and family violence and homelessness, by using data on clients who access homelessness services, their reasons for seeking assistance, and their circumstances.
The report, Domestic and family violence and homelessness 2011–12 to 2013–14 found that around 520,000 Australians accessed homelessness services over the three years to 2013–14, with 187,000 (36%) being adults and children seeking assistance due to domestic and family violence. Among these, six vulnerable groups were identified: women with children, young women presenting alone (15–24 years), Indigenous women, women from non-English speaking backgrounds (NESB), older women and males.
'Specialist homelessness services (SHS) agencies provide crisis and emergency accommodation as well as a range of financial, health, specialist, general and housing support services,' said Tim Beard, Acting Head of the AIHW's Housing and Specialised Services Group.
Most clients able to transition into stable housing
'Over the study period, SHS agencies were able to assist most domestic or family violence clients to acquire or retain secure housing in either private rental or social housing,' Mr Beard said.
This was particularly true of women with children (3 in 4 acquiring or retaining secure housing), older women (8 in 10) and non-English speaking women (7 in 10).
'However, for groups who were already more likely to be couch surfing, have no tenure, or be sleeping rough, the likelihood of securing stable accommodation was lower.'
What services are needed? Are these needs being met?
Almost half (48%) of domestic and family violence clients needed short-term or emergency accommodation, with Indigenous women (72%) and males (61%) in greatest need. In most cases these needs were met, although young women presenting alone, and males, were the least likely to have their need met (16% of clients in each group did not have their needs met).
'In contrast, there was greater unmet need among those seeking long-term accommodation,' Mr Beard said.
Across all six groups, 32% of clients required long-term housing, but of these, less than 1 in 10 were able to be provided with the assistance they requested.
Longer periods of support, more return clients
Domestic and family violence clients required more support than other clients, generally requiring longer—and a greater number of—periods of support (Table 1).
Indigenous women, males, and young women presenting alone received the most support on average.
These groups included young women presenting alone (48% housed) and males (38% housed).
| SHS Client Group | Average number of support periods | Average days of support | |
|---|---|---|---|
| Not experiencing domestic and family violence | All | 1.9 | 92 |
| Experiencing domestic and family violence | All | 2.4 | 136 |
| Indigenous women | 3.4 | 170 | |
| Males | 3.3 | 167 | |
| Young women presenting alone | 3.0 | 173 | |
View Domestic and family violence and homelessness 2011–12 to 2013–14.
If you are experiencing domestic or family violence or know someone who is, please call 1800RESPECT (1800 737 732) or visit the 1800RESPECT website.
New opportunities: MBS and PBS data now at AIHW
In late 2015, the Department of Health issued a Public Interest Certificate for the supply of data from the Medicare Benefits Schedule (MBS) and Pharmaceutical Benefits Scheme (PBS) to the AIHW, with an eye to achieving 'a better understanding of a wide range of diseases, health conditions, and treatments to achieve significant improvements in the health and wellbeing of all Australians.'
Since then, the AIHW has received five years of de-identified MBS and PBS data. These data are sourced from the claims processing systems administered by the Department of Human Services. These data are now managed by AIHW's Statistical and Analytical Support Unit, under the guidance of the AIHW MBS and PBS Data Steering Committee.
What is MBS and PBS data?
The MBS data holds records for subsidised services by health professionals such as doctors, specialists, optometrists—and in specific circumstances—dentists, and other allied health practitioners.
The PBS data holds records for subsidised prescription drugs dispensed by approved suppliers .
In 2015, there were more than 350 million MBS services claimed and more than 200 million PBS drugs dispensed in Australia.
How will the AIHW use this new resource?
As one of only three Commonwealth Integrating Authorities, the AIHW is well equipped to securely and appropriately facilitate research projects involving the use of this important Commonwealth data asset.
The AIHW will use MBS and PBS data to report on many important aspects of Australia's health and health system, including:
- trends in health care use
- inequalities in access and use
- health expenditure
- variations in quality of care
- risk factors for health
- disease prevalence and impact
- variations in self management
- pathways through the health system.
What's next?
The AIHW will build a number of analytical products to suit different analyst and researcher needs, along with our own reporting and statistical summaries from the data. We will develop metadata and other supporting documentation to assist in the use and interpretation of data. These products will be available via the AIHW website.
Risk factors and chronic disease: reduce one, avoid many
A variety of reports are now showing that many chronic diseases share the same risk factors—and by modifying these risk factors, a person can reduce his or her likelihood of developing a chronic disease.
'The term 'chronic disease' refers to diseases that tend to be long lasting and have persistent effects—for example, type 2 diabetes, coronary heart disease, and several types of cancer,' said Ms Ann Hunt, Head of the AIHW's Population Health and Primary Care Unit.
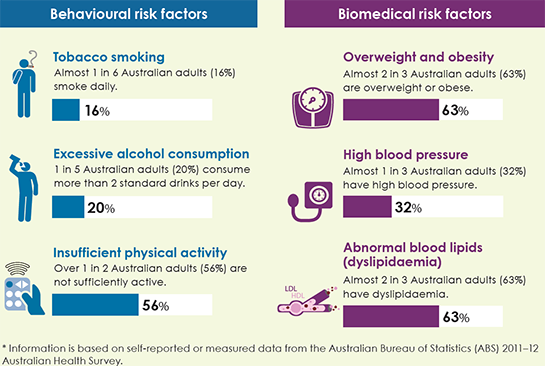
New analysis looks at the relationship between certain chronic diseases and behavioural and biomedical risk factors.
Behavioural risk factors are those that individuals can modify through changes to their behaviour—for example, diet, tobacco smoking and drinking alcohol.
Biomedical risk factors, on the other hand, are bodily states—such as obesity and high blood pressure—and are often influenced by behavioural risk factors.
'For example, tobacco smoking is a risk factor for multiple chronic diseases, including coronary heart disease, stroke, lung cancer and chronic obstructive pulmonary disease,' Ms Hunt said.
Likewise, obesity is a risk factor for several chronic diseases, such as coronary heart disease, type 2 diabetes, colorectal cancer and depression.
The new analysis highlights the importance of minimising risk factors whenever possible.
'By modifying a risk factor, individuals can reduce their risk of developing not only one chronic disease, but sometimes many,' Ms Hunt said.
Prevalence of selected behavioural and biomedical risk factors for Australians aged 18 and over*
Back to the source: returning data to Indigenous communities
For nearly a decade, the Department of Health has funded the AIHW to collect performance indicator data directly from organisations that provide primary health care to Aboriginal and Torres Strait Islander people.
The national key performance indicators for Indigenous primary health care (the nKPIs) comprises a set of 24 indicators that aim to improve the delivery of primary health care with a focus on maternal and child health, preventative health and chronic disease.
The indicators include both process of care indicators, such as timing of first antenatal visit and health assessment recording, and outcome indicators, such as blood pressure and kidney function test results for clients with type 2 diabetes.
Not only are nKPI data analysed and used for national reporting in many ways, service level data are returned to the communities they came from, so service providers can use this objective information to improve the health services they provide.
There are currently 242 Indigenous-specific primary health care organisations that contribute to the nKPIs, with over 40% of these located in remote and very remote areas. These organisations are the main providers of primary health care services to clients in these areas and therefore play an important role in working to improve health outcomes for Aboriginal and Torres Strait Islander people.
'By returning organisation level data to these individual services, along with comparative national, state and regional data, organisations can examine trends and patterns in their processes and outcomes,' said Dr Fadwa Al-Yaman, Head of the Institute's Indigenous and Children's Group.
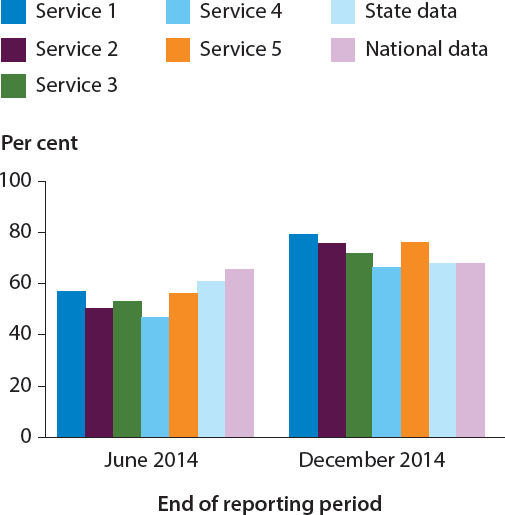
Kimberly Aboriginal Medical Service (KAMS) in Western Australia, for example, used nKPI data for their organisation and four member services to identify where organisations were performing well (Figure 1).
The data were used to generate conversations between services to identify each other's strengths and learn where improvements could be made.
'A practical example of the improvements possible can be seen in KAMS, where, with access to their own data, these organisations were able to improve their processes to ensure blood pressure information was recorded for clients with type 2 diabetes,' Dr Al-Yaman said.
Dr Al-Yaman said that this is an example of the power of data to help deliver better health services in Indigenous communities.
'It is also a good example of the AIHW's strategic priority of providing value-added feedback to data providers.'
Figure 1: Proportion of clients with type 2 diabetes with blood pressure recorded in the last six months, selected services in Western Australia
Children in out-of-home care: their perspectives

Insights into the views and experiences of children in out-of-home care are explored in the AIHW report, The views of children and young people in out-of-home care: overview of indicator results from a pilot national survey, 2015.
'Out-of-home care is overnight care provided to vulnerable children who have been, or are at risk of being, abused, neglected or otherwise harmed,' said Mr Mark Cooper-Stanbury, Acting Head of the AIHW's Community Services and Communications Group.
Out-of-home care can be provided in several settings, including designated facilities or private residences.
According to the report, the majority of children in out-of-home care feel safe and settled in their current placement.
'We found that 91% of surveyed children felt both safe and settled, with another 4% feeling safe but not settled, and 2% feeling settled but not safe,' Mr Cooper-Stanbury said.
More than two-thirds (67%) of the children surveyed said they usually have a say in what happens to them, and that people usually listen to what they say.
The majority (94%) described feeling close to at least one family group—either the people they live with now, family members they do not live with, or both.
'And the vast majority (97%) said that they have an adult who cares about what happens to them now and in the future,' Mr Cooper-Stanbury said.
Most children (86%) reported having at least some knowledge of their family background and culture, and 87% reported that they received adequate support, either from their carer or someone else, to participate in sport, community or cultural activities.
More than half (58%) felt that they were getting as much help as they needed to make decisions about their future, while a further 30% said that they were getting some help but wanted more. Another 12% said that they were not receiving adequate assistance in this area.
The report presents results from a new national survey collected as part of state and territory local case management processes during February to June 2015. The responses of 2,083 children aged 8–17 who were under the care of the Minister or Chief Executive in the eight states and territories are reported against eight indicators under the National Standards for Out-of-Home Care.
'The survey was a pilot study and provides valuable information on how local case management processes can be used to give children in care a voice,' Mr Cooper-Stanbury said.
Powerful insights from linked data

Data linkage brings together information about people, places and events from different data collections based on common features. Linked data provides a more comprehensive picture of a subject, and is one of the most powerful ways of adding value to the data already held by many organisations. Data linkage projects are already providing significant new insights that are improving the health care of Australians.
The AIHW has a strong record in data linkage—or data integration—both in its own work and in facilitating the work of other researchers. The AIHW has been accredited as one of three Integration Authorities for the integration of Commonwealth data-meaning that the Institute has met stringent criteria covering project governance, capability, data management, and the protection of privacy and confidentiality.
'Linked data can unlock valuable information by connecting data about individual's health conditions with the treatments they receive and the longer-term outcomes that result for them,' said Mr Geoff Neideck, Head of the Institute's Data Strategies and Information Technology Group.
'The insights we can gain through data linkage mean there are significant real world benefits for individuals and society.'
Examples of current data linkage projects are research investigating the effectiveness and safety of childhood vaccines; the health and social outcomes of injecting drug users; the health outcomes for people living near the Hazelwood mine fire; and the care of people with acute coronary syndrome.
The Institute is working closely with state data linkage units to bring together Commonwealth and state health and community services data for particular projects. Examples include:
- Better Cardiac Care Projects (NSW and Queensland), which are examining Aboriginal and Torres Strait Islander people's access to appropriate and equitable preventive and treatment services for cardiac disease
- the Cancer Pathways Project (Victoria) that seeks to identify the best pathways of care for people with colorectal or breast cancer
- a project on fragility fractures (SA) to identify the risk of serious bone fractures in older Australians who have already had a relatively minor fracture.
Mr Neideck explained how in one study, the AIHW undertook the data linkage for a large project led by University of Melbourne researchers examining the long-term effects of low dose radiation from computed tomography (CT).
'Results showed that CT scans in children and young people have a small but highly significant effect on their risk of developing cancer, although this varies with the site of scan and child's age,' Mr Neideck said.
This study was published in the British Medical Journal (BMJ) and was the most cited article from that journal in 2014.
'Partly due to this work, the Australian Commission on Safety and Quality in Health Care has recently released new guidelines for CT scans in children,' Mr Neideck said.
The future of data linkage at the AIHW looks to be increasingly busy and exciting.
'New arrangements for Medicare data mean that the processes for gaining approvals and obtaining linked data are much more efficient and timely, which will open up new data linkage possibilities,' Mr Neideck said.
See New opportunities: MBS and PBS data now at AIHW for more information.
Social media at the AIHW
Did you know the AIHW uses Twitter and YouTube?
Twitter is being used more and more at the AIHW to keep followers informed about new releases and goings on at AIHW. We now have over 10,000 followers!
The AIHW's YouTube channel offers audiences another platform from which they can access AIHW information. We recently produced a series of short videos associated with the report Australian Burden of Disease Study: impact and causes of illness and death in Australia 2011. These videos provide a simple summary of some of the report's key themes.
We also have AIHW apps on the Apple iOS platform—OzHealth, OzWelfare and Indigenous Health and Welfare Statistics—all free!
These apps present facts and figures in interesting, colourful, and easy-to-use formats, making them particularly valuable for students and teachers, and giving the general public an engaging view of health and welfare statistics. The apps also include a comprehensive glossary and additional information about the AIHW. The OzHealth and OzWelfare apps each include a multiple-choice question quiz, with answers and scores, drawn from a bank of questions within the app.
To coincide with the release of the Australia's health 2016 report on 13 September, we released an Android version of the OzHealth app, which allows Android users and those who use Google Play to access the app.
Find us
- Twitter: @aihw

- YouTube: Australian Institute of Health and Welfare
- App store: Australian Institute of Health and Welfare
- Infographics
New releases
Youth justice in Australia 2014–15 fact sheets
This set of 11 fact sheets provide detailed information on various aspects of youth justice supervision in Australia. The fact sheets include information on the young people under youth justice supervision in Australia during 2014–15 because of their involvement or alleged involvement in crime.
Published 31 August 2016
Chronic airways disease risk factors & comorbidities (WEB 119)
People with asthma often have other chronic diseases and long-term conditions. These are referred to as 'comorbidities'. The chronic conditions selected for analysis in this web report include cardiovascular disease, back problems, mental health problems, arthritis, diabetes, chronic obstructive pulmonary disease, and cancer. The report shows that 6 in 10 Australians with asthma currently have at least one other chronic condition.
Published 23 August 2016
Exploring drug treatment and homelessness in Australia: 1 July 2011 to 30 June 2014
There is much research to suggest a considerable overlap between people experiencing precarious housing, and those experiencing drug and alcohol misuse. By linking client data from specialist homelessness services and alcohol and other drug treatment services, this report provides a picture of the intersection of these two issues on a national scale—and identifies a group of almost 40,000 people who accessed both service types between 2011–2014.
Published 18 August 2016
Impacts of chronic back problems
Chronic back problems are common conditions in Australia, affecting 16% of the total population. They can have a strong negative effect on a person’s quality of life, affecting their ability to participate in daily activities, work, family and social activities. This bulletin provides the latest detailed information on the impacts of chronic back problems in Australia.
Published 16 August 2016
OECD health-care quality indicators for Australia 2015
This report summarises information Australia provided to the Organisation for Economic Co-operation and Development's Health at a glance 2015 report, and compares data supplied by Australia in 2015 with data it supplied for previous years and with data reported by other OECD countries. The OECD Health Care Quality Indicators provide a common set of data about the quality of health care delivered across participating OECD member countries.
Published 27 July 2016
Musculoskeletal conditions as underlying and associated causes of death
This report looks at the contribution of musculoskeletal conditions to deaths in Australia. Although musculoskeletal conditions were not among the leading underlying causes of death, the report shows that these conditions were likely to have contributed to about 1 in 20 deaths in Australia in 2013.
Published 14 July 2016
Skin cancer (melanoma and non-melanoma skin cancers) accounts for the largest number of cancers diagnosed in Australia each year. The report shows that while the age-standardised incidence rate has risen for most age groups, for Australians aged less than 40, the incidence rate for melanoma of the skin has declined.
Published 13 July 2016
Monitoring the health impacts of mandatory folic acid and iodine fortification
This report explores the health effects of mandatory folic acid and iodine fortification, introduced to help reduce the prevalence of neural tube defects and address the re-emergence of iodine deficiency in the population. Mandatory fortification resulted in increased levels of folic acid and iodine in the food supply, increased folic acid and iodine intakes, a decreased rate of neural tube defects in Australia, and improved iodine status in the general populations in Australia and New Zealand.
Published 28 June 2016
Alcohol and other drug treatment services in Australia 2014–15
Alcohol and other drug (AOD) treatment services assist people to address their drug use through a range of treatments. This report shows that in 2014–15, around 850 alcohol and other drug treatment services provided just over 170,000 treatment episodes to around 115,000 clients. The top 4 drugs that led clients to seek treatment were alcohol, cannabis, amphetamines and heroin.
Published 15 June 2016
Medication use by Australia's prisoners 2015: how is it different from the general community?
This report compares medications taken by prisoners with people in the general community. The poor health and complex health needs of prisoners are reflected in the number and types of medications they take. Prisoners were more likely than those in the general community to be taking medication for health problems including mental health issues, addictions and chronic conditions.
Published 10 June 2016
Disability support services: services provided under the National Disability Agreement 2014–15
This bulletin explores the characteristics of disability services users and the types of services they access. It shows that in 2014–15, around 333,800 people used disability support services under the National Disability Agreement (NDA)—a 6% increase since 2010–11 and a 4% increase since 2013–14. The most common service group used was community support (45%), followed by employment (44%), community access (17%), accommodation support (13%) and respite (11%).
Published 8 June 2016