Chapter 1 Our performance
This chapter encompasses our 2017–18 performance statement, which is the required means for reporting on all performance criteria included in our corporate plan. It focuses on achievements against our key performance indicators and expected major deliverables for the year.
The chapter also summarises our financial performance, which is detailed in our 2017–18 financial statements in Appendix 6, our compliance with legislation on reporting and an overview of findings from the Australian Institute of Health and Welfare’s (AIHW’s) inaugural stakeholder survey.
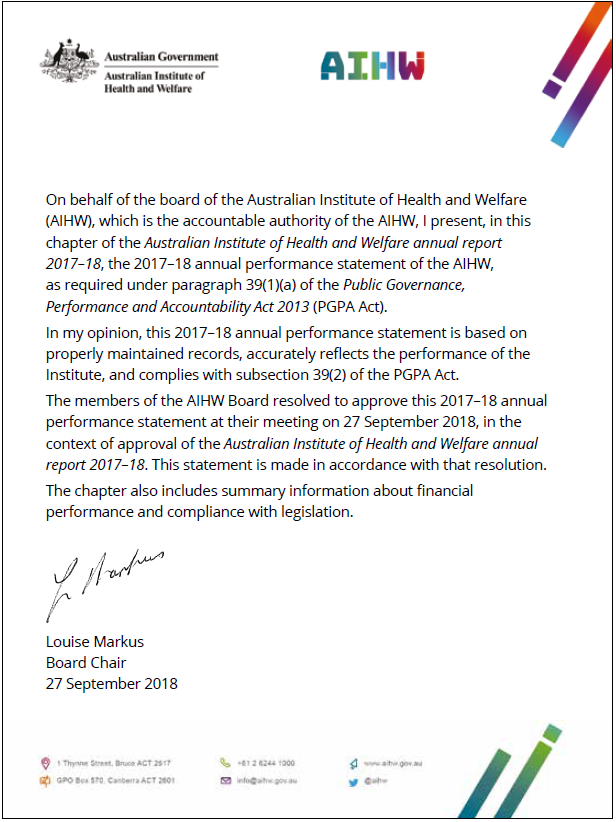
Statement by accountable authority
Our purpose
To create authoritative and accessible information and statistics that inform decisions and improve the health and welfare of all Australians.
Our work provides governments, key stakeholders and the broader Australian community with valuable evidence and insights about key issues affecting the health and welfare of Australia’s population.
The information and data we publish, and otherwise make available, inform open debate and discussion at the national and jurisdictional levels, and in the broader community, on significant issues aimed at securing a sustained increase in quality of life for Australians.
Outcome
A robust evidence base for the health, housing and community sectors, including through developing and disseminating comparable health and welfare information and statistics.
We are committed to providing high-quality, independent evidence on health and welfare in Australia, presented in meaningful and relevant ways and delivered in a timely manner. Accurate statistical information, comprehensive data development, high-quality analyses and related services support an increased understanding of health and welfare issues. This evidence base is critical to good policy making and effective service delivery, both of which have a direct impact on the lives of Australians.
External confidence in the AIHW is demonstrated by our exemplary reputation and acknowledgment of our achievements over 30 years. It is also reflected in the high level of engagement with us by other organisations, in terms of pursuit of joint endeavours and use of our services. Another way to assess the value placed on our contribution is the level of our external funding and the volume and variety of commissioned project work.
Our achievements and valued contribution rest on our demonstrated record in providing information that is:
- authoritative, accurate, accessible and timely
- useful for governments, service providers and the community
- in formats that are useful to individual users.
Public Governance, Performance and Accountability Act 2013 (PGPA Act)
As required under the PGPA Act, this report contains the AIHW’s annual performance statement for 2017–18. The annual performance statement details results achieved against the planned performance set out in the 2017–18 Portfolio Budget Statements (PBS) and the Australian Institute of Health and Welfare Corporate Plan 2017–18 to 2020–21.
Program
Develop, collect, analyse and report high-quality national health and welfare information and statistics for governments and the community.
Program objectives and performance criteria
Our corporate plan includes 2 program objectives:
- providing health and welfare information and analysis
- providing leadership and improvements in health and welfare data and information.
Twenty-four targets relating to these objectives are grouped into 7 performance criteria. Of these, 4 relate to the first program objective and 3 to the second program objective.
The sources for these criteria and targets are the 2017–18 PBS and the AIHW’s 2017–18 corporate plan available at Australian Government 2017–18 Health Portfolio Budget Statements and AIHW Corporate Plan 2017–18 to 2020–21, respectively.
Summary of our performance results
Twenty-two of 24 targets were met. Details of performance against targets for each criterion are provided in tables 1.1 to 1.7.
92% of all measurable performance targets were met in 2017–18
Deliverables contributing to program objective 1: providing health and welfare information and analysis
Table 1.1: Results for 2017–18 program objective 1: providing health and welfare information and analysis—performance criterion 1
| 2017–18 target | 2017–18 result |
|---|---|
| Present Australia’s welfare 2017 to the Minister for Health by 31 December 2017. | √ Australia’s welfare 2017 was released on 19 October 2017. |
| Present Australia’s health 2018 to the Minister for Health by 30 June 2018. | √ Australia’s health 2018 was released on 20 June 2018. |
Release products by 30 June 2018 relating to:
|
√ Health expenditure Australia 2015–16 was released on 6 October 2017.
√ Admitted patient care 2016–17: Australian hospital statistics was released on 24 May 2017. √ The National Drug Strategy Household Survey 2016: detailed findings was released on 28 September 2017. √ Updates to the online Mental Health Services Australia pages on 13 October 2017 included:
√ Cause of death patterns and people’s use of aged care: a Pathways in Aged Care analysis of 2012–14 death statistics was released on 24 January 2018. |
Overall result: 7 of 7 targets met
Australia’s welfare 2017

Australia’s welfare 2017 is the AIHW’s 13th biennial flagship report on welfare. It is framed around ‘welfare’ in its broadest context. The report is underpinned by the concept that a person’s wellbeing results from the interplay of many interrelated individual, societal and environmental factors, and introduces the ‘person-centred data model’.
The 2017 edition of Australia’s welfare provides a comprehensive coverage of welfare topics. It looks at welfare with respect to various population groups and sectors, including children and youth, education and training, employment, housing, ageing and aged care, and disability. The report also includes an overview of what we know about family, domestic and sexual violence; a discussion on how to better understand health and welfare data; a chapter dedicated to the welfare of Indigenous Australians; and 2 feature articles authored by academic experts—‘Persistent disadvantage in Australia: extent, complexity and some key implications’ (Professor Alan Hayes and Dr Andrew Hacker) and ‘The changing nature of work and worker wellbeing’ (Professor Mark Wooden). The report concludes with a comprehensive analysis of welfare indicators based on a framework developed by the AIHW.
Australia’s welfare 2017: in brief is a companion report to Australia’s welfare 2017 that summarises key statistics and concepts from the main report. This edition of Australia’s welfare also contained a variety of online resources, including supplementary data tables.
The full report is available at Australia's welfare 2017.
Australia’s health 2018

Australia’s health 2018 is the AIHW’s 16th biennial flagship report on the health of Australians. The report profiles our health status and use of health services, outlining the leading types of illness, risk factors, health behaviours, and the services available to help prevent and treat ill health. The report also contains a breadth of information on the health—and health inequalities— experienced by selected population groups, including Indigenous Australians; people from culturally and linguistically diverse backgrounds; veterans; lesbian, gay, bisexual, transgender and intersex Australians; and those living in rural and remote areas.
Australia’s health 2018 looks at some topical health issues in depth, including the contribution of risk factors to disease burden; the impact of the natural environment on our health; and factors contributing to the increasing prevalence of overweight and obesity in Australia. Other featured topics include mesothelioma—Australia has one of the highest diagnosis rates in the world for this cancer—and the increasing harm caused by the use of both pharmaceutical and illegal opioids.
To meet the growing demand for timely and accessible digital content, the AIHW flagship reports are moving towards more diverse, layered formats. The 2018 edition of Australia’s health includes a range of online visual presentations that supplement some material in the report. This includes, for the first time, dedicated online reporting of Australia’s performance against national indicators of health. The online version includes dynamic or interactive data visualisations for selected topics. A summary of the key statistics and concepts in the main report feature in the companion report, Australia’s health 2018: in brief.
The report is available at Australia's health 2018.
'The findings in the report will underpin important work by governments to develop policies and programs as well as providing valuable sources of information for every Australian.'
–The Hon Greg Hunt MP.
Table 1.2: Results for 2017–18 program objective 1: providing health and welfare information and analysis—performance criterion 2
| 2017–18 target | 2017–18 result |
|---|---|
| Provision of free, high-quality information measured by the release or completion of: | |
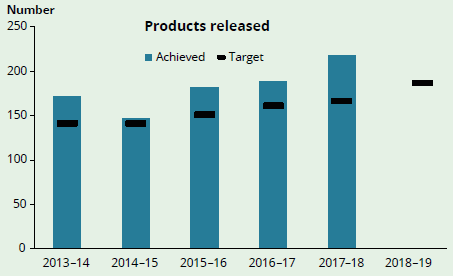
| 176 products | √ The AIHW released 218 products during 2017–18 including 144 print-ready and 74 web products.
Figure 1.1 shows the trends from 2013–14 onwards and the target for 2018–19
|
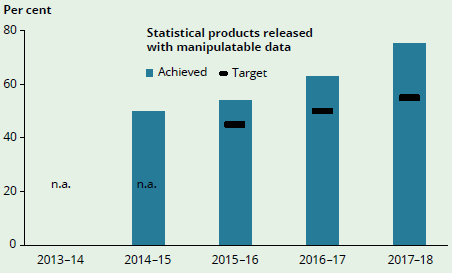
| ≥56% statistical products released that include data in a manipulable format | √ 75% of the AIHW’s statistical products released in 2017–18 included interactive data allowing users to produce the specific information they are seeking. The percentage continues to increase as more of our products use data visualisation tools and/or include manipulable data tables.
Figure 1.2 shows the trends from 2014–15 onwards. This indicator will be reported as a whole number from 2018–19
n.a. not applicable |
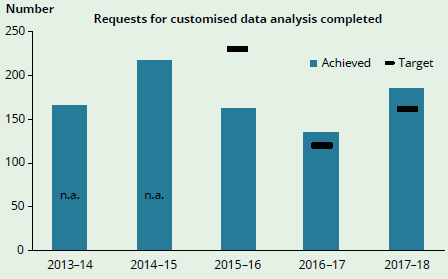
| 160 completed requests for customised data analysis | √ The AIHW completed 184 requests for customised data analysis.
Figure 1.3 shows the trends from 2013–14 onwards. Targets from 2016–17 were revised to be consistent with current demand estimates. This indicator has changed for 2018–19 hence target not shown
n.a. not applicable |
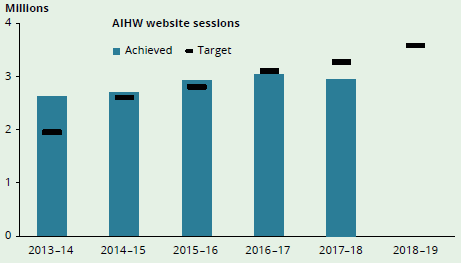
| 3.3 million sessions on the AIHW website | x The AIHW recorded 2,939,038 sessions on its website in 2017–18.
Figure 1.4 shows the trends from 2013–14 onwards and the target for 2018–19
A dip in website sessions compared to previous years was reported from September to December 2017, a temporary consequence of the introduction of the new AIHW website in September 2017. The figures increased again from January 2018 and were above previous years in the last quarter of 2017–18. |
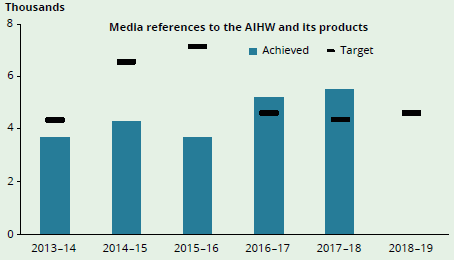
| 4,300 references to the AIHW and its products in the media | √ There were 5,472 references to the AIHW and its products in the media in 2017–18. Targets from 2016–17 onwards were revised for consistency with past media coverage sourced from media monitoring.
Figure 1.5 shows the trends from 2013–14 onwards and the target for 2018–19
|
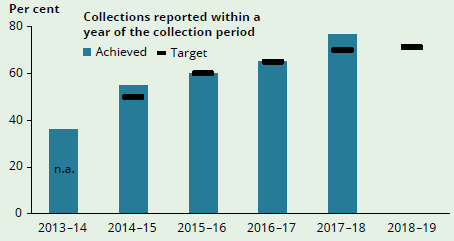
| ≥70% statistical products relating to annual national collections for which data are reported less than 1 year after the end of the data collection period | √ Data for 76% of AIHW annual national collections were reported less than 1 year after the end of their data collection period.
Figure 1.6 shows the trends from 2013–14 onwards and the target for 2018–19
n.a. not applicable Publications produced by AIHW collaborating centres are not included. The elapsed time to release of these products includes:
|
| ≥70% statistical products relating to annual national collections for which data are reported less than 1 year after the end of the data collection period | We work with data providers to introduce systems that assist them in providing data more quickly. For example, using the AIHW’s Validata™ application, data providers can validate the data they supply more easily and quickly. Together with our own efforts to reduce time taken to release data, this allows us to report earlier in the collection cycle than in previous years for those collections. |
Overall result: 5 of 6 targets met
Table 1.3: Results for 2017–18 program objective 1: providing health and welfare information and analysis—performance criterion 3
| 2017–18 target | 2017–18 result |
|---|---|
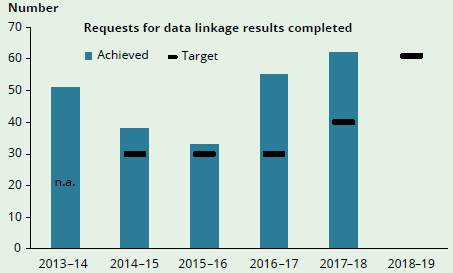
| Satisfy requests for data linkage relating to more than 40 projects by 30 June 2018 | √ The AIHW completed data linkage services for 61 projects, including linkage of other data sets to Medicare Benefits Schedule (MBS) and Pharmaceutical Benefits Scheme (PBS) data, the National Death Index and the Australian Cancer Database, as agreed under the strategy.
Figure 1.7 shows the trends from 2013–14 onwards and the target for 2018–19.
n.a. not applicable |
| Satisfy requests for data linkage relating to more than 40 projects by 30 June 2018 | Projects may be for academic researchers, government departments or research agencies. We continue to work to enhance our data linkage and analytical capabilities and methodologies.
As well as requests for customised data analysis from external clients, some researchers request results of data linkages between their data collections and ours. In these cases, they must submit project proposal applications for ethical clearance (see ‘AIHW Ethics Committee’) before being granted access to linkage results. The AIHW Ethics Committee secretariat and relevant data custodians provide advice on how to progress these applications. Once approval is granted, the AIHW undertakes the linkages in a secure environment on a cost-recovery basis. In both 2016–17 and 2017–18, we far exceeded our targets. We have raised our target for 2018–19 in recognition of the increased interest in data linkage across the health and welfare sectors. |
Overall result: target met
Table 1.4: Results for 2017–18 program objective 1: providing health and welfare information and analysis—performance criterion 4
| 2017–18 target | 2017–18 result |
|---|---|
| Supply data required for performance indicators in the Council of Australian Government’s (COAG's) national agreements on health-care and Indigenous reform by 30 June 2018. | √ The AIHW provided data for the COAG's national agreements on health-care and Indigenous reform by 30 June 2018. |
| Supply data to timetables required for the Review of Government Service Provision’s Report on Government Services 2018 volumes on health, housing and homelessness, and community services. | √ The AIHW provided data for the publication of the Review of Government Service Provision’s Report on Government Services 2018 volumes on health, housing and homelessness, and community services. |
| Release products relating to local-level health performance indicators by 30 June 2018. | √ A range of products were released by 30 June relating to local-level health performance indicators (includes MyHospitals and MyHealthyCommunities websites). |
Overall result: 3 of 3 targets met
Deliverables contributing to program objective 2: providing leadership and improvements in health and welfare data and information
Table 1.5: Results for 2017–18 program objective 2: providing leadership and improvements in health and welfare data and information—performance criterion 5
| 2017–18 target | 2017–18 result |
|---|---|
| Complete work toward the Coordination of Health Care Study, linking data from participants in the Australian Bureau of Statistics (ABS) Survey of Health Care with other data sets to find out about their use of primary care, hospital and emergency department services, and pharmaceuticals for periods before and after the survey. | √ Work toward the Coordination of Health Care Study undertaken in collaboration with the ABS was completed, including data linkages on primary care and pharmaceuticals. The first Survey of Health care report was released on the ABS website. A second report, Healthy Communities: Coordination of Health Care–experiences with GP care among patients aged 45 and over, 2016 is due for release on 26 July 2018. |
| Release products by 30 June 2018 relating to under-identification of Indigenous people in key data sets. | √ The report Trends in Indigenous mortality and life expectancy 2001–2015 was released on 1 December 2017. |
| Improve data in at least 1 subject area where there is a demonstrable data gap; for example, family and domestic violence, primary health care or disability. | √ The report Family, domestic and sexual violence in Australia 2018 was released on 28 February 2018. |
Overall result: 3 of 3 targets met
Table 1.6: Results for 2017–18 program objective 2: providing leadership and improvements in health and welfare data and information—performance criterion 6
| 2017–18 target | 2017–18 result |
|---|---|
| Release a redeveloped AIHW website, including links to content from the former National Health Performance Authority. | √ Redeveloped AIHW website was launched in September 2017. |
Overall result: target met
Table 1.7: Results for 2017–18 program objective 2: providing leadership and improvements in health and welfare data and information—performance criterion 7
| 2017–18 target | 2017–18 result |
|---|---|
| Complete analysis of linked data from 3 national cancer screening programs by 30 June 2018. | √ Analysis of linked data from three national cancer screening programs was completed by 30 June 2018. |
| Complete the second of three work phases to improve storage, accessibility and analysis of locational data in AIHW data holdings, enabling better information on, for example, patterns and trends of service use. | x The first of three phases of work to improve storage, accessibility and analysis of locational data in AIHW data holdings was completed. Phase 2 is currently underway. |
| Demonstrate, as case studies, AIHW contributions shown externally in 2017–18 of improved reporting of population- or service-related health and welfare outcomes. | √ The AIHW contributed to the improved reporting of population- or service related health and welfare outcomes in 2017–18 as demonstrated by the release of the following products:
|
Overall result: 2 of 3 targets met
Looking ahead
Our strategic goals
Over the next 5 years, we will apply and strengthen our capabilities to be:
- leaders in health and welfare data
- drivers of data improvements
- expert sources of value-added analysis
- champions for open and accessible data and information
- trusted strategic partners.
Priority action areas
The following 10 priority action areas are critical to achieving our strategic goals and responding to changes in the environment. We will continue to work closely with stakeholders in each of these areas:
- Data governance
- Data management infrastructure
- Data analysis capability
- Data gaps
- Data accessibility
- Timeliness
- Our processes
- Communication and stakeholder engagement
- Presentation of work
- Our people and structures.
Each of these priority areas is sponsored by a senior executive and features various projects and activities. Further information regarding the priority areas can be found in the Australian Institute of Health and Welfare Corporate Plan 2017–18 to 2020–21 at AIHW Corporate Plan 2017–18 to 2020–21.
AIHW Stakeholder survey
The AIHW commissioned Essence Communications to conduct an inaugural comprehensive survey in October 2017 of the perceptions of a range of its stakeholders. The online survey split key stakeholders into three tiers, with each tier receiving a different mix of survey questions:
- tier 1: senior executives in government, private and non-government sectors who had some awareness of the AIHW
- tier 2: informed users of AIHW products and services, funders and data providers
- tier 3: agencies and organisations to which the AIHW would like to offer products and services in the future; these respondents may not be aware of the Institute.
Overall results of the survey were positive and provided evidence that the Institute is achieving its strategic objectives.
Highlights
- Awareness and knowledge: A high proportion of respondents (over 90%) from tiers 1 and 2 were aware of the AIHW and familiar with its work. They viewed the AIHW as a ‘one-stop shop’ for trusted and accessible information in health and welfare.
- Trust: A very high percentage of key stakeholders considered the AIHW to be a ‘well trusted’ organisation. Similarly, there was very high product trust among key stakeholders in the data, statistics and information the AIHW produces.
- Satisfaction and meeting expectations: Key stakeholders were largely satisfied with AIHW data, analyses and services and in how the AIHW is meeting their expectations.
- Engagement: The vast majority of key stakeholders had interacted with the AIHW in the previous 12 months, mainly by using AIHW reports or data/statistics.
- Flagship reports: Stakeholders deemed the Institute’s flagship reports (Australia’s health and Australia’s welfare) to be of high value.
- National asset: Stakeholders viewed the AIHW as a national asset that provided value to Australia, and as a leader in health and welfare data, statistics and information.
For improvement
- Engagement: Stakeholders expect the AIHW to better understand and anticipate their needs beyond current levels of service.
- Timeliness: The AIHW needs to work on managing expectations about product releases.
- Flagship reports: There is a need to make Australia’s health and Australia’s welfare reports more user friendly and timely in release.
- AIHW products: Many products/services are unknown and therefore under-utilised. Readers expect the AIHW to help them understand policy or practice implications of reports or data releases.
Reinforcing our strategic goals
Results of the survey also provide evidence to measure performance against the Institute’s 5 strategic goals.
Survey results will help the Institute improve its services for stakeholders and build evidence on areas for improving stakeholder services. Insights from the survey will guide a new strategic stakeholder engagement strategy and enable the Institute to measure performance against its Strategic directions 2017–2021.
Our financial performance
Results
The AIHW’s financial results since 2013–14 are summarised in Table 1.8.
Table 1.8: Financial results, 2013–14 to 2017–18 ($ million)
| Financial results | 2013–14 | 2014–15 | 2015–16 | 2016–17 | Change 2016–17 to 2017–18 |
2017–18 |
|---|---|---|---|---|---|---|
| Income | 52.982 | 49.240 | 48.401 | 57.844 | Increase | 65.075 |
| Expenditure | 52.926 | 48.671 | 48.135 | 57.768 | Increase | 64.942 |
| Surplus | 0.056 | 0.569 | 0.266 | 0.076 | Increase | 0.133 |
| Total assets | 37.200 | 42.119 | 42.612 | 73.536 | Increase | 93.675 |
| Total liabilities | 32.471 | 36.821 | 36.926 | 42.606 | Increase | 63.045 |
| Total equity | 4.729 | 5.298 | 5.686 | 30.930 | Decrease | 30.630 |
Income and expenditure
The AIHW has 2 main types of income—appropriation income from the Australian Parliament and income from externally funded projects—including budgeted revenue for the next 4 years.
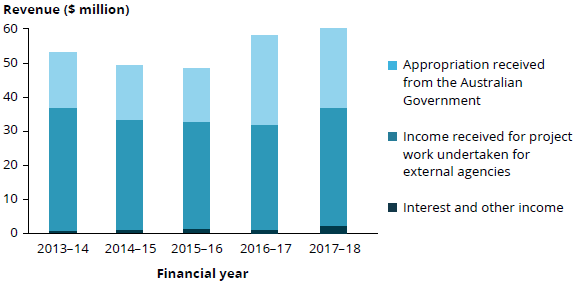
Our appropriation income was $28.1 million in 2017–18, compared with $26.8 million in 2016–17 (Table 1.9 and Figure 1.8). This increase was due to new funding from the ‘Public Modernisation Fund’ to enable AIHW participation in the Data Integration Partnership for Australia partly offset by efficiency dividends and wage cost index adjustments required by the Australian Government.
Income from externally funded projects rose to $35.1 million in 2017–18 from $29.6 million in 2016–17—an increase of 18.6%. Most of this income came from Australian Government departments, with the largest source being the Department of Health.
Interest income rose to $1.8 million in 2017–18, compared with $1.0 million in 2016–17.
Employee-related expenditure increased to $38.3 million in 2017–18 from $36.5 million in 2016–17.
The overall result for the year was a surplus of $133,000.
Table 1.9: Income and expenditure, 2013–14 to 2017–18 ($ million)
| Income and expenditure | 2013–14 | 2014–15 | 2015–16 | 2016–17 | Change 2016–17 to 2017–18 |
2017–18 |
|---|---|---|---|---|---|---|
| Appropriation revenue | 15.898 | 15.800 | 15.625 | 26.918 | Increase | 28.078 |
| Revenue for project work for external agencies | 36.176 | 32.365 | 31.334 | 29.628 | Increase | 35.096 |
| Interest | 0.890 | 0.682 | 0.759 | 1.021 | Increase | 1.759 |
| Other revenue | 0.018 | 0.394 | 0.683 | 0.277 | Decrease | 0.142 |
| Total revenue | 52.982 | 49.240 | 48.401 | 57.844 | Increase | 65.075 |
| Employee-related expenditure | 36.173 | 35.054 | 33.817 | 36.436 | Increase | 38.253 |
| Other expenditure | 16.753 | 13.617 | 14.318 | 21.332 | Increase | 26.689 |
| Total expenditure | 52.926 | 48.671 | 48.135 | 57.768 | Increase | 64.942 |
| Surplus | 0.056 | 0.569 | 0.266 | 0.076 | Increase | 0.133 |
Figure 1.8: Revenue sources, 2013–14 to 2017–18
Balance sheet
Assets totalled $93.7 million in 2017–18—a rise of $20.2 million on the previous year (Table 1.10). The cash balance component of financial assets remains high at $74.7 million, most of which is invested in term deposits in accordance with our investment policy.
Liabilities rose by $20.4 million to $63.0 million in 2017–18, from $42.6 million in 2016–17. This was due mostly to an increase in income received in advance and employee provisions.
Overall, total equity decreased to $30.6 million from $30.9 million last year.
Table 1.10: Balance sheet summary, 2013–14 to 2017–18 ($ million)
| Balance sheet summary | 2013–14 | 2014–15 | 2015–16 | 2016–17 | Change 2016–17 to 2017–18 |
2017–18 |
|---|---|---|---|---|---|---|
| Financial assets | 26.821 | 32.420 | 33.655 | 64.471 | Increase | 85.111 |
| Non-financial assets | 10.379 | 9.699 | 8.957 | 9.065 | Decrease | 8.564 |
| Total assets | 37.200 | 42.119 | 42.612 | 73.536 | Increase | 93.675 |
| Provisions | 10.967 | 11.082 | 11.817 | 12.108 | Increase | 12.645 |
| Payables | 21.504 | 25.739 | 25.109 | 30.498 | Increase | 50.400 |
| Total liabilities | 32.471 | 36.821 | 36.926 | 42.606 | Increase | 63.045 |
| Equity | 4.729 | 5.298 | 5.686 | 30.930 | Decrease | 30.630 |
Cash flow
Net cash received from operating activities in 2017–18 was $16.0 million. This related mainly to income received in advance at the end of year. We spent a net amount of $1.1 million on the purchase of property, plant and equipment, and leasehold improvements in 2017–18, compared with $0.8 million in 2016–17.
The net cash increase over the year was $15.0 million, increasing the cash balance to $74.7 million from $59.7 million (see the ‘Cash flow statement for the period ended 30 June 2018’ in Appendix 6).
Financial outlook
Appropriation income will increase by $6.3 million in 2018–19 consistent with the 2018–19 Budget measures National Health and Medical Industry Growth Plan and Improving Housing Related Data. This will be offset by whole-of-Australian Government efficiencies. We have budgeted for income from externally funded projects of approximately $38.0 million (see Figure 1).
We have budgeted to break even in 2018–19, before an accrual of $282,000 which is required to comply with relevant accounting standards in relation to the AIHW’s new office lease. We have obtained approval from the Department of Finance to run at a loss to cover this accrual to the end of 2021–22. This will have no effect on cash balances and will reverse over the lifetime of the lease.
The value of our land and buildings is expected to fall in 2018–19 due to depreciation of fit-out costs, which will continue over the term of the lease. However, we will be moving to an additional building for extra staff which will involve additional fit-out and ICT equipment.
Auditor-General’s report
The Australian National Audit Office conducts an annual audit of our financial statements. It issued an unqualified audit opinion that the financial statements for 2017–18 were appropriately prepared and give a ‘true and fair view’ of our financial position (see the auditor’s report).
Our compliance with legislation on reporting
We complied with the key legislative and regulatory requirements that must be reported in this annual report. Information may be found on:
- the Work Health and Safety Act 2011 and the Environment Protection and Biodiversity Conservation Act 1999 in Chapter 5 Our people.
- other specific matters required to be reported by legislation in Appendix 5.
The ‘Compliance index’ details the sources of the various compliance requirements.


