Australian Burden of Disease groups
Not all health expenditure is directly related to a burden of disease condition or group. Some expenditure relates to interactions for purposes such as health maintenance (such as yearly health or dental checks) or investigation of potential health problems, which remain undiagnosed.
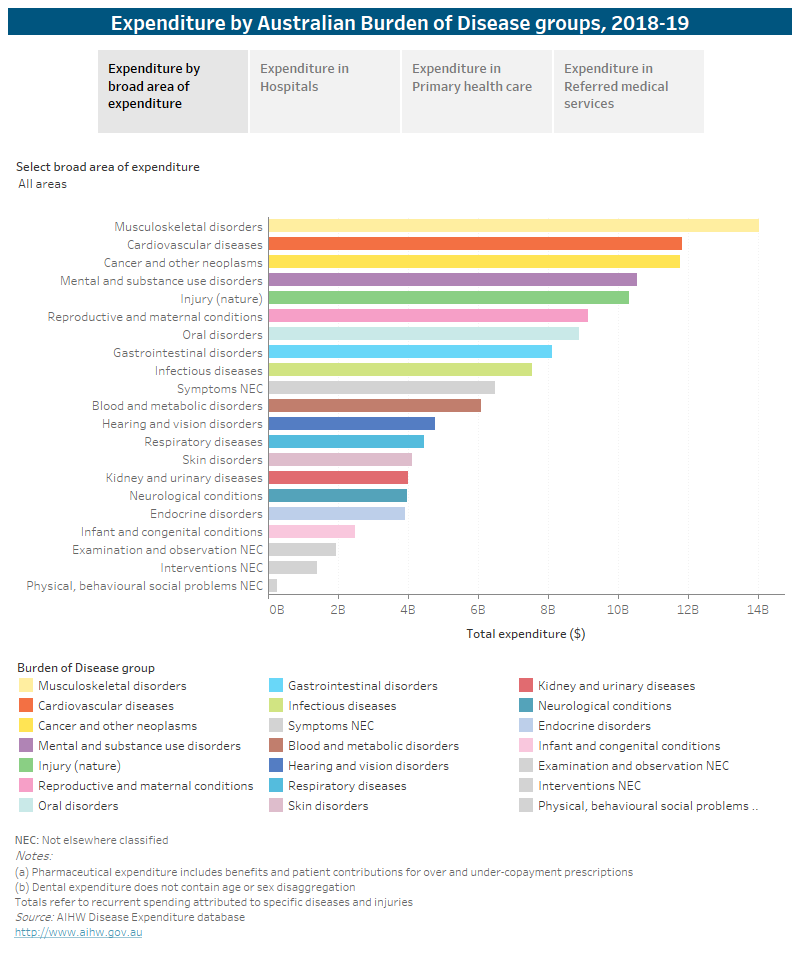
Of the estimated $117.0 billion of health expenditure included in this study, approximately 8 per cent related to signs and symptoms, interventions, examination and observation, and physical, behavioural social problems not elsewhere classified.
The condition groups with the highest expenditure were Musculoskeletal disorders, followed by Cardiovascular disease and Injuries.
The proportion of total spending related to condition groups varies substantially according to age group, sex, and area of expenditure.
- The most expensive disease groups for admitted patients in public hospitals were Cardiovascular diseases, injuries, and gastrointestinal disorders. In private hospitals, these were Musculoskeletal disorders, Cancer and other neoplasms, and Cardiovascular diseases.
- Expenditure on general practitioner services was highest for infectious diseases, followed by Mental and substance use disorders, and Cardiovascular diseases.
- More than half of expenditure for allied health and other health practitioners related to Mental and substance use disorders, with almost a third relating to Hearing and vision disorders.
It is important to note that the cost of disease is not just financial: being unwell or suffering from a health condition has other effects on quality of life, affecting people’s ability to work or do the activities they enjoy. These expenditure estimates do not include direct costs from outside of the health care sector or estimates of the indirect costs due to illness.
Looking at how much is financially expended on treating, managing, or preventing conditions does not tell the full story, which is why the AIHW also studies disease in terms of its ‘burden’, or human cost, which can be found in the Australian Burden of Disease Study report.
Due to methodological differences, the expenditure on a condition group relative to the burden cannot be used to directly draw conclusions about the relative level of funding for conditions. These aspects are explained further in the How do we measure the cost of disease? fact sheet.
The following interactive data visualisations can be used to display expenditure on condition groups by age and sex, for each area of expenditure. Data used to create the visualisations can also be downloaded as an Excel workbook.
Note that expenditure in this visualisation is prepared on a different basis than in the Health Expenditure Australia reports. For details on the estimation methods, scope of data included, and comparability to previous studies, readers are directed to the Disease Expenditure 2015–16 Study: Overview of analysis and methodology report.


