Area of spending
This stacked bar chart shows the estimated health system spending among different areas of expenditure in 2019-20. An estimated $87.9 billion was spent on disease groups within the hospital setting compared to $39.7 billion in primary health care and $12.8 billion for referred medical services.

Figure 1 below shows how total health spending for 2019–20 as reported in Health expenditure Australia 2020–21 relates to spending reported in Disease expenditure Australia 2019–20.
Figure 1: Areas of health spending included in the disease expenditure study
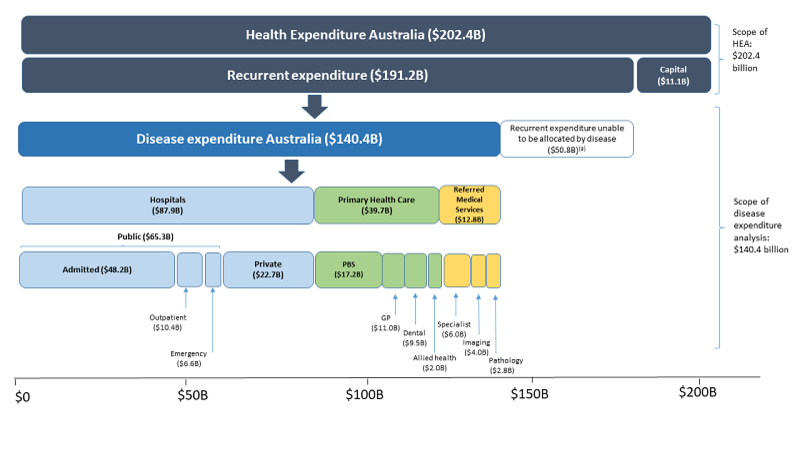
Note: (a) Recurrent spending unable to be allocated by disease includes for example, administration expenditure, and most community and public health programs. Refer to Table 2.2 in Disease Expenditure Study: Overview of Analysis and Methodology 2019–20 for further information on the type of expenditure that has not been allocated by disease.
Some components of recurrent spending are allocated differently between the health expenditure Australia database, and the disease expenditure study. This approach was taken to reflect patterns of healthcare use for particular conditions, which is the focus of this body of work, rather than health funding arrangements. For example:
- Public hospitals spending is further reported as emergency department, admitted patient, and outpatient clinic spending in this study.
- This study includes $1.5 billion of highly specialised PBS drugs dispensed in hospitals as PBS spending, while the health expenditure database reports this as hospital spending.
- In this disease expenditure study, $6.4 billion of MBS services provided in hospitals as part of an admission are allocated to public and private hospitals, while the majority of this spending is counted in referred medical services in the health expenditure database.
See visualisation below. For further information, please refer to the Technical notes and the Disease Expenditure Study: Overview of analysis and methodology 2019–20 report.
This bar chart provides a comparison between expenditure allocated to broad areas of expenditure in the Health expenditure database versus the Disease Expenditure database in 2019-20.
Disease groups could be allocated to Hospitals, Primary health care and Referred medical services.

The first bar chart shows the estimated disease expenditure attributable by sex among different age groups in 2019-20.
The X-axis shows total expenditure and the Y-axis shows age groups ranging from < 1 year to 85 years and over. For total persons, the highest expenditure was found in the 70-74 years old group whereas the lowest was seen in the 5-9 years old group.
The second bar chart displays total disease spending by sex and age group across either broad or detailed area of expenditure.
