Trends by area of spending
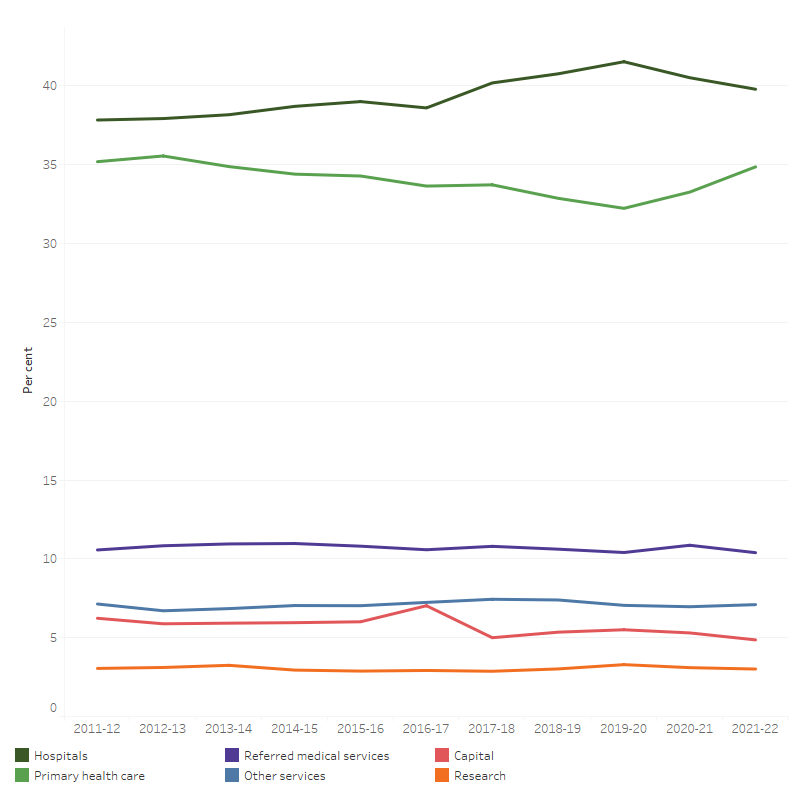
In 2021–22, total health spending was distributed across health services, with estimates of:
- 39.8% ($96.0 billion) on hospitals
- 34.9% ($84.1 billion) on primary health care
- 10.4% ($25.1 billion) on referred medical services
The remaining 15.0% or $36.1 billion, was on other services, research and capital spending (Figure 23).
Over the period up to 2018–19, spending on hospitals has tended to increase faster than spending on primary health care (3.3% on average per year compared with 2.3%, in real terms). However, this appeared to shift during the pandemic (2019–20 to 2021–22), when spending on primary health care (including public health) increased in real terms by 6.8% on average per year, more quickly than spending on hospital services at an average annual growth of 4.2%.
Figure 23: Proportion of total health spending, by area of expenditure, current prices, 2011–12 to 2021–22
The line graph shows that the proportion of total health spending spent on each area of spending remained relatively stable between 2011–12 and 2021–22. Hospitals and primary health care attracted the most funding over the decade. In 2021–22, hospitals received 39.8 per cent of total health spending, followed by primary health care received 34.9 per cent. In the same year, referred medical services attracted 10.4 per cent of total funding; other services received 7.0 per cent, and research receiving 3.0 per cent. The proportion of funds allocated to capital spending over the decade was most volatile, at 7 per cent in 2016–17 compared with 4.9 per cent in 2021–22.

Notes
- Spending on the medical expenses tax rebate is not included.
- Other services include patient transport services, aids and appliances, and administration.
Source: AIHW Health Expenditure Database (Table 28).


