Government spending
The National Partnership on COVID-19 Response (NPCR) and spending on COVID–19 related programs by the Australian Government Department of Health and Aged Care were two main sources of government spending.
State and territory governments may have contributed funding for COVID–19 outside of the NPCR, however this funding has not been included in this report as it was difficult to ensure the consistency of reporting across jurisdictions and accurately determine the source of the funding for each jurisdiction. It is reasonable to assume, however, that the NPCR captures the vast majority of state and territory government COVID-19 related spending.
National Partnership on COVID–19 Response (NPCR)
The NPCR, agreed to and signed by the Council of Australian Governments (COAG) in March 2020, and administered by the Administrator of the National Health Funding Pool (the Administrator) and the National Health Funding Body, is a collaborative initiative established between the Australian Commonwealth government and the state and territory governments to effectively manage the COVID–19 pandemic response. The NPCR was split into three types of payments:
- Hospital services payments (HSP)
- State public health services payments (SPHP)
- Private hospital financial viability (FVP)
The HSP includes activity in the public hospital sector, pathology / diagnostic costs relating to testing for COVID–19 and activity in private hospital sector as directed by States (as public patients). The activities include admitted patient care, emergency department presentations and non–admitted hospital care.
The SPHP includes additional public health activities such as securing additional emergency PPE supplies, providing funding to expand critical ICU and ventilation capacity, boosting contact tracing and public health communication, supporting additional cleaning in hospitals, schools and public transport, and the vaccinations program. From 2021, Vaccine Dose Delivery Payments were included as a part of SPHP.
The FVP payments enable critical resources from the private hospital sector to be available to public hospital sector including clinical, auxiliary staff, hospital, and ICU beds. (NHFB 2022).
The Australian Government and state and territory governments contributed equally to the NPCR funding with the exception of the financial viability payments to private hospitals which was funded solely by the Australian Government.
The total NPCR spending for 2019–20 to 2021–22 was $24.9 billion, $13 billion by the Australian Government and $11.8 billion by state and territory governments. In aggregate over the three years the public health payment was the largest area of spending at $16.1 billion, followed by hospital services $7.5 billion and FVP $1.3 billion.
Figure 1: NPCR by source and by payment type, current prices, 2019–20 to 2021–22
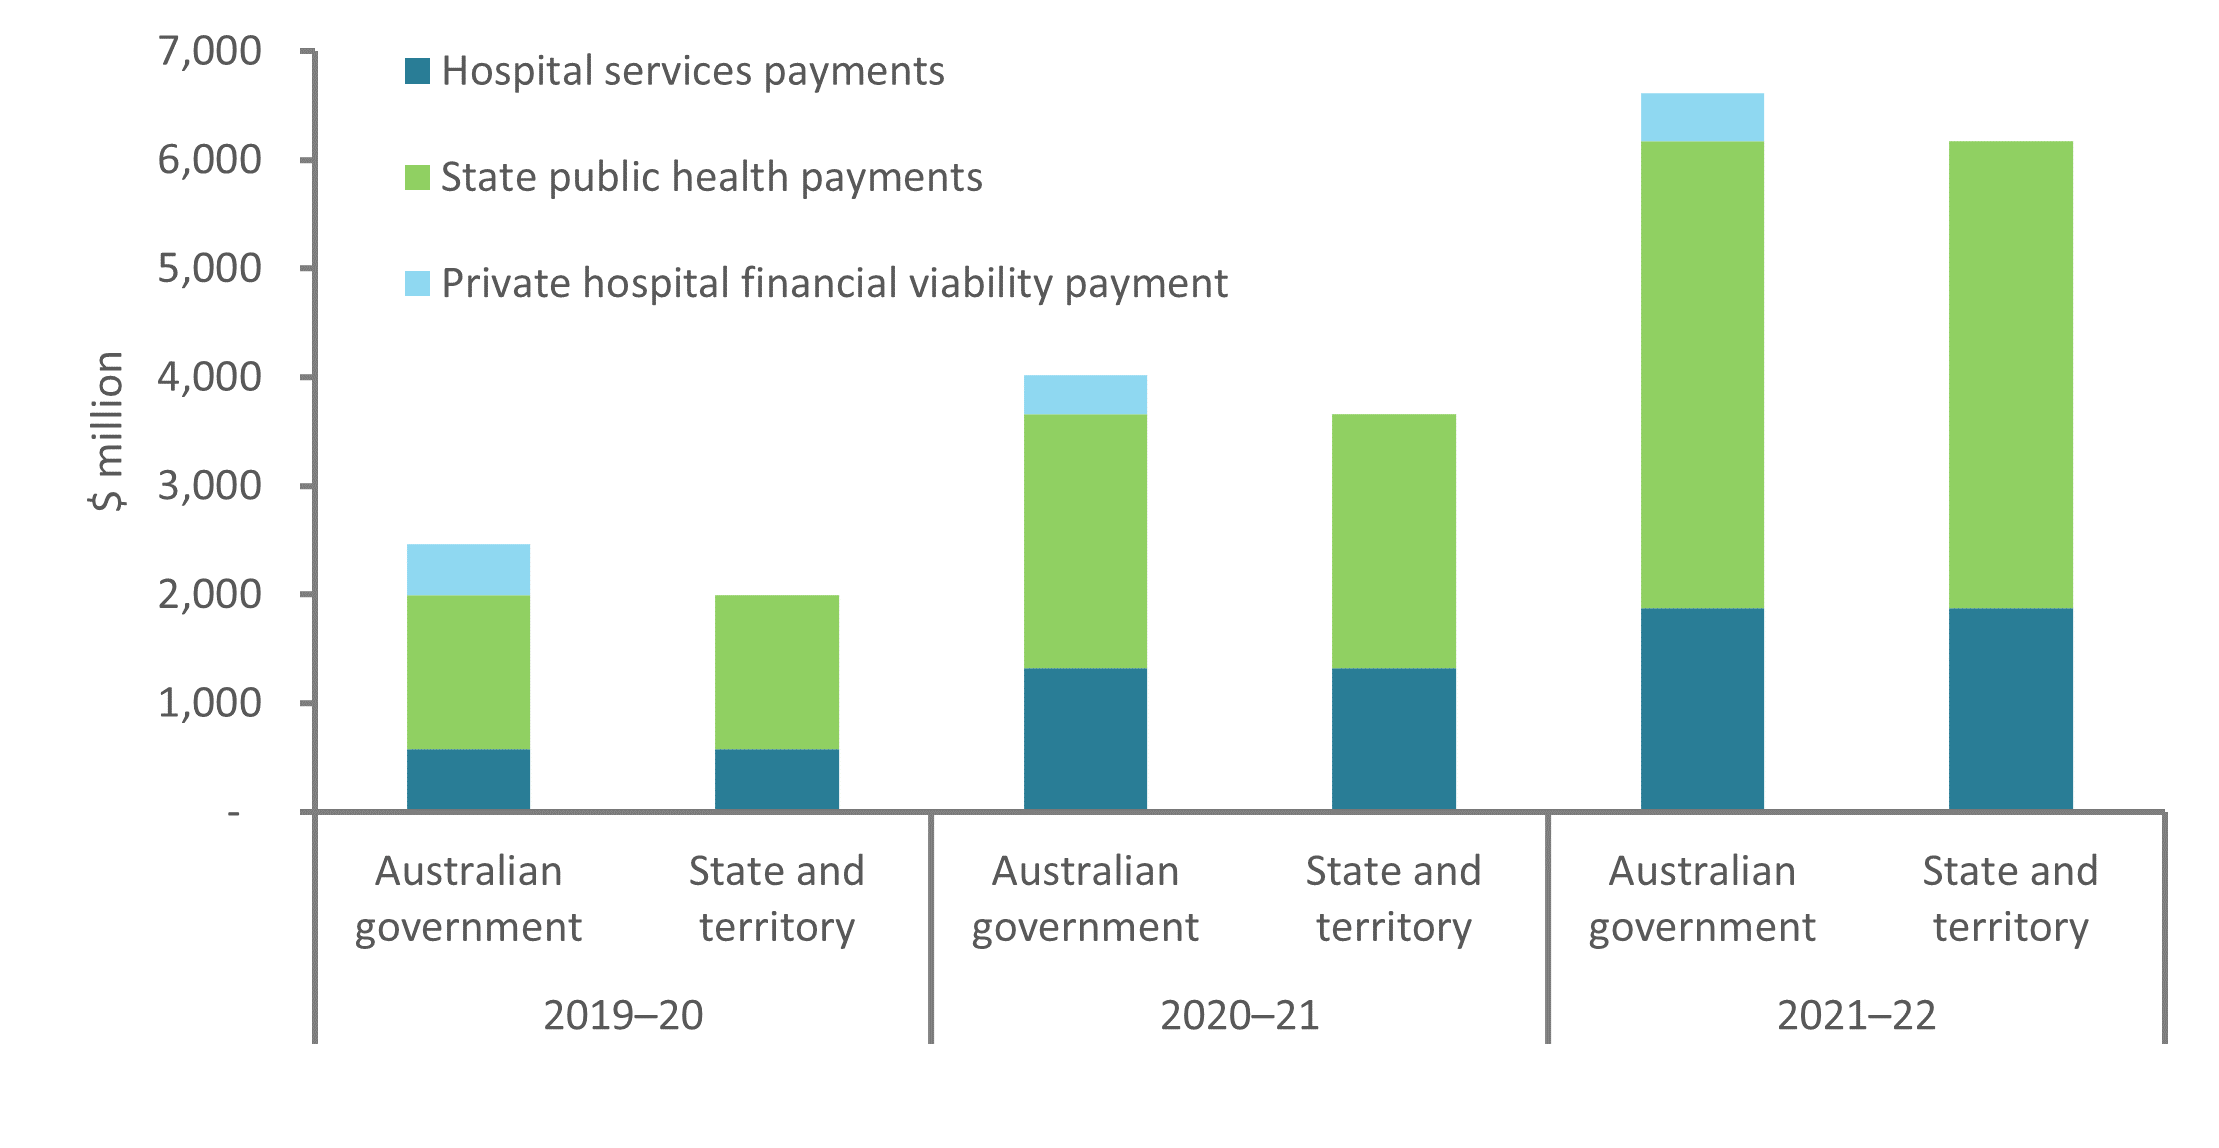 Chart: AIHW
Source: National Health Funding Body
Hospital services payments (HSP)
From 2019–20 to 2021–22, $3.7 billion was spent on HSP, which included public and private hospital services (admitted, non–admitted and emergency department activities) and covid testing. For context, during this period, 74 million COVID–19 tests were conducted in Australia (3% in 2019–20, 25% in 2020–21 and 72% in 2021–22) (NHFB).
Figure 2: Hospital Services Payments by program from 2019-20 to 2021-22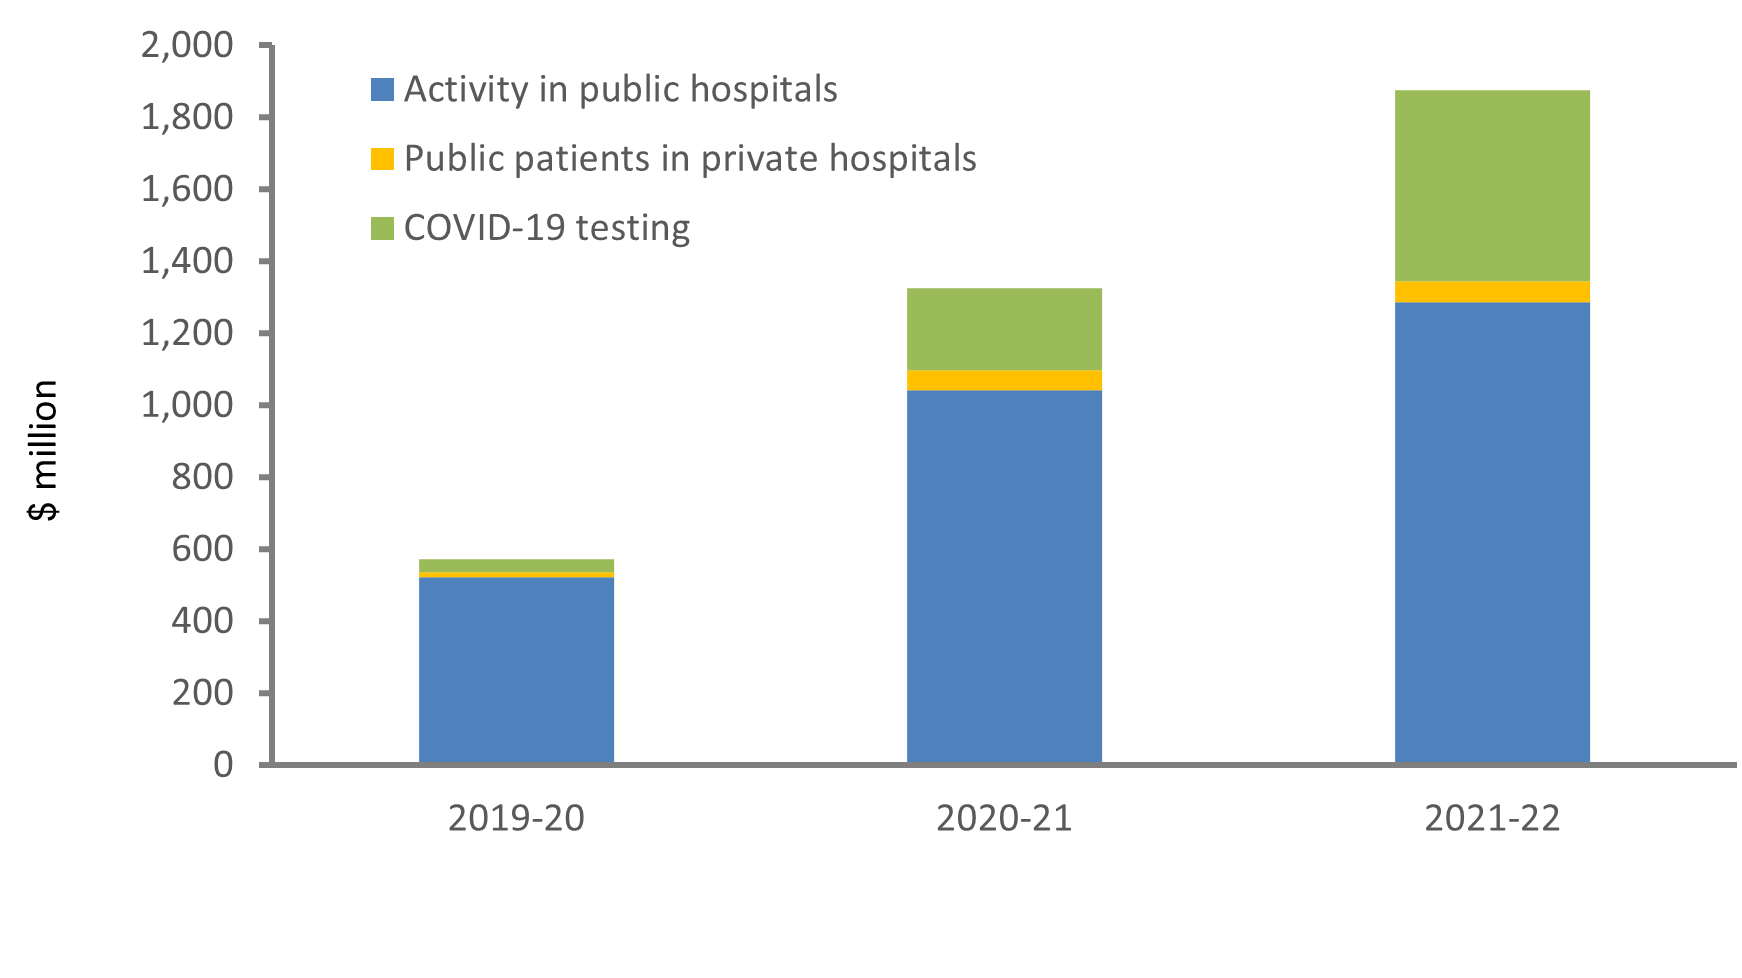
Chart: AIHW
Source: National Health Funding Body.
State Public Health Payments (SPHP)
From 2019–20 to 2021–22, $8 billion was spent on SPHP, which included public health activities (such as the vaccination rollouts and communications to address the COVID–19 response), rapid antigen tests, personal protective equipment, primary care services, aged care (mainly staffing support) and non–clinical services. The SPHP also included capital expenditure, equipment, border force and airport screening, which are included in the category ‘other’ in Figure 3 below.
For context, by 30 June 2022, over 95% of the Australians aged 16 and over received at least two doses of a COVID–19 vaccine and almost 60.3 million doses had been administered across Australia. (Department of Health 2022).
Figure 3: State Public Health Payments by program from 2019–20 to 2021–22
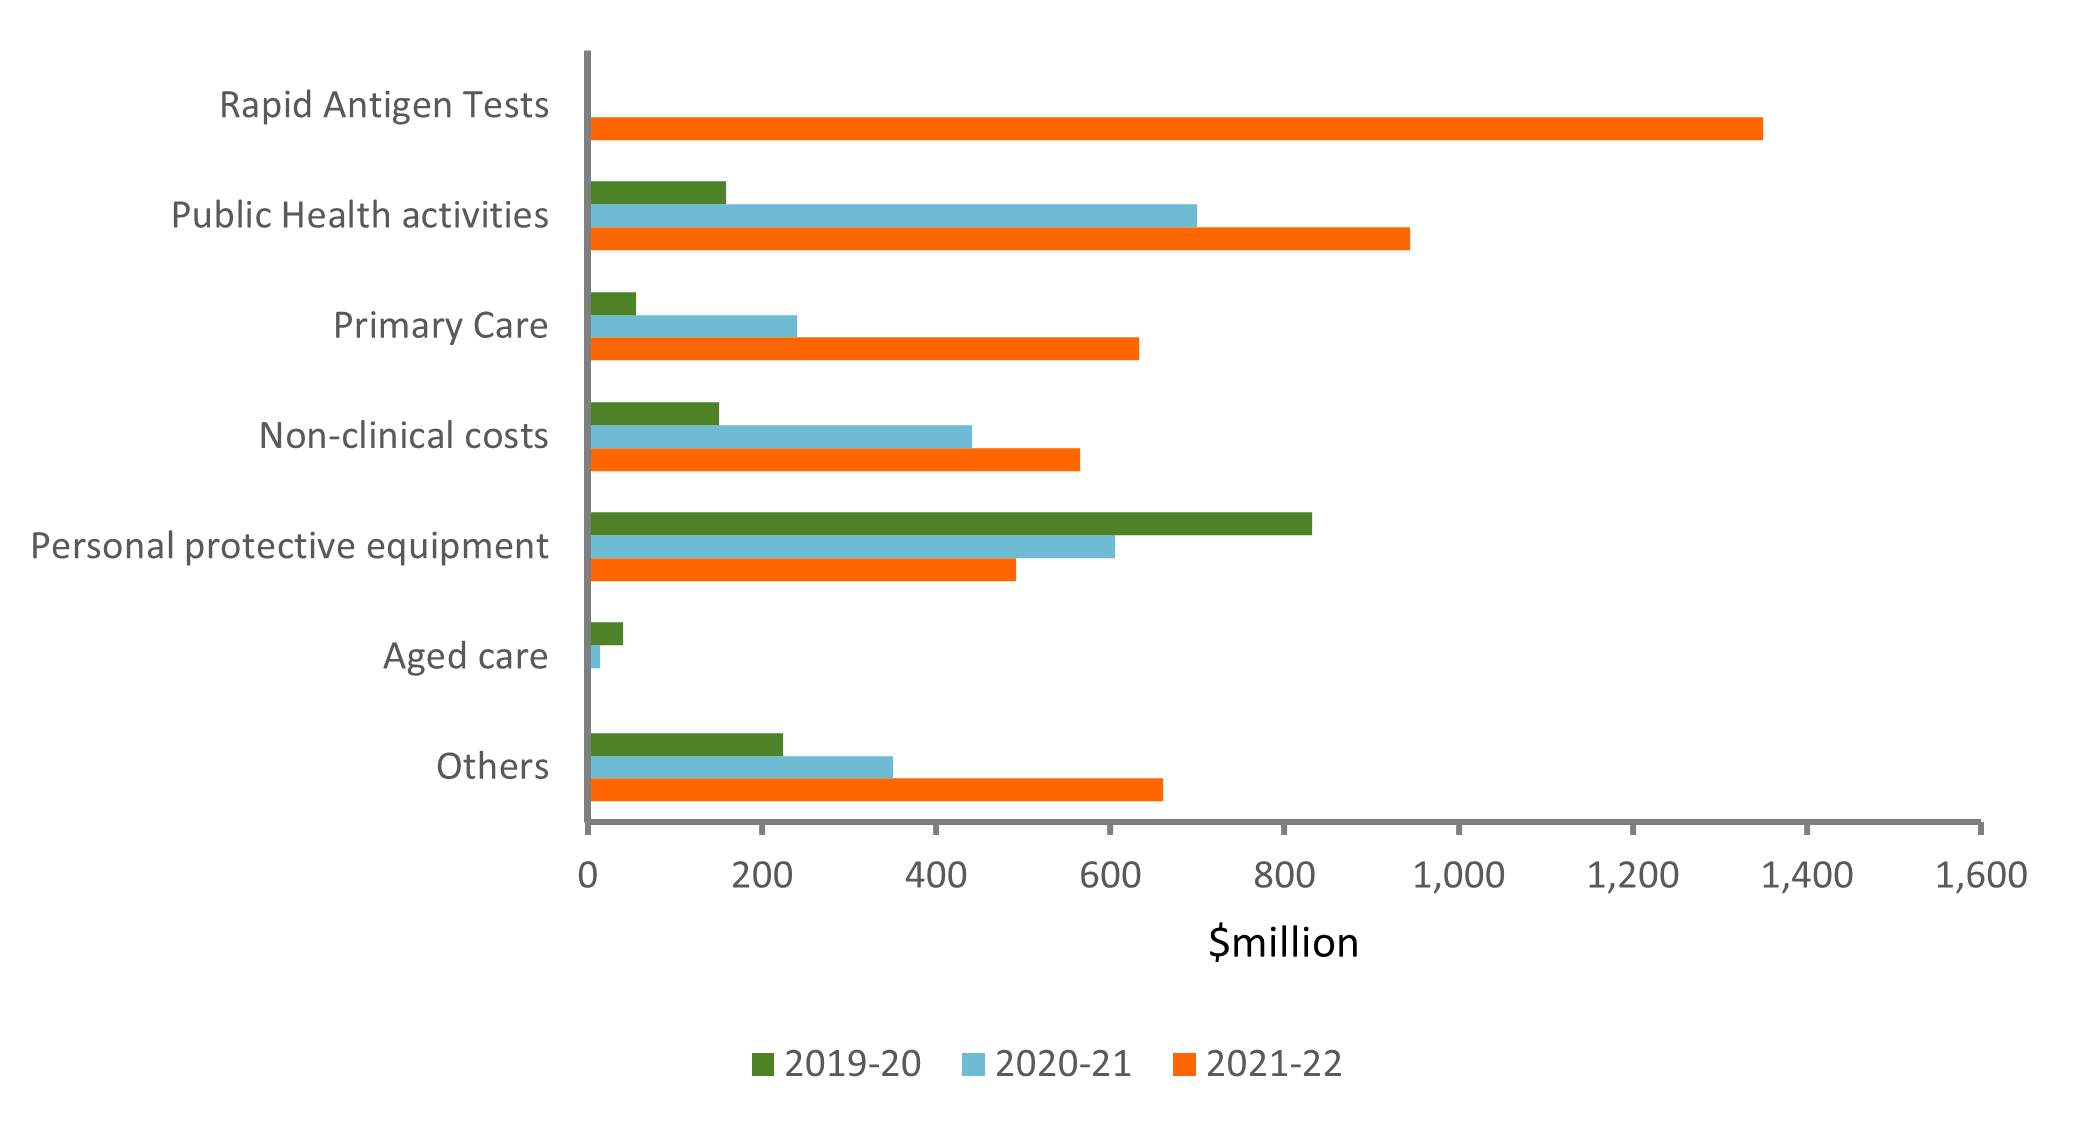
Chart: AIHW
Source: National Health Funding Body.
Private Hospital Financial Viability Payment (FVP)
From 2019–20 to 2021–22, $1.2 billion was spent on the FVP. This funding comprised three broad subcomponents: a financial viability and capability payment, a fund for private hospital equipment and the redeployment of the health workforce to public hospitals and Commonwealth directed private hospital activity.
Figure 4: Private Hospital Financial Viability Payment from 2019–20 to 2021–22
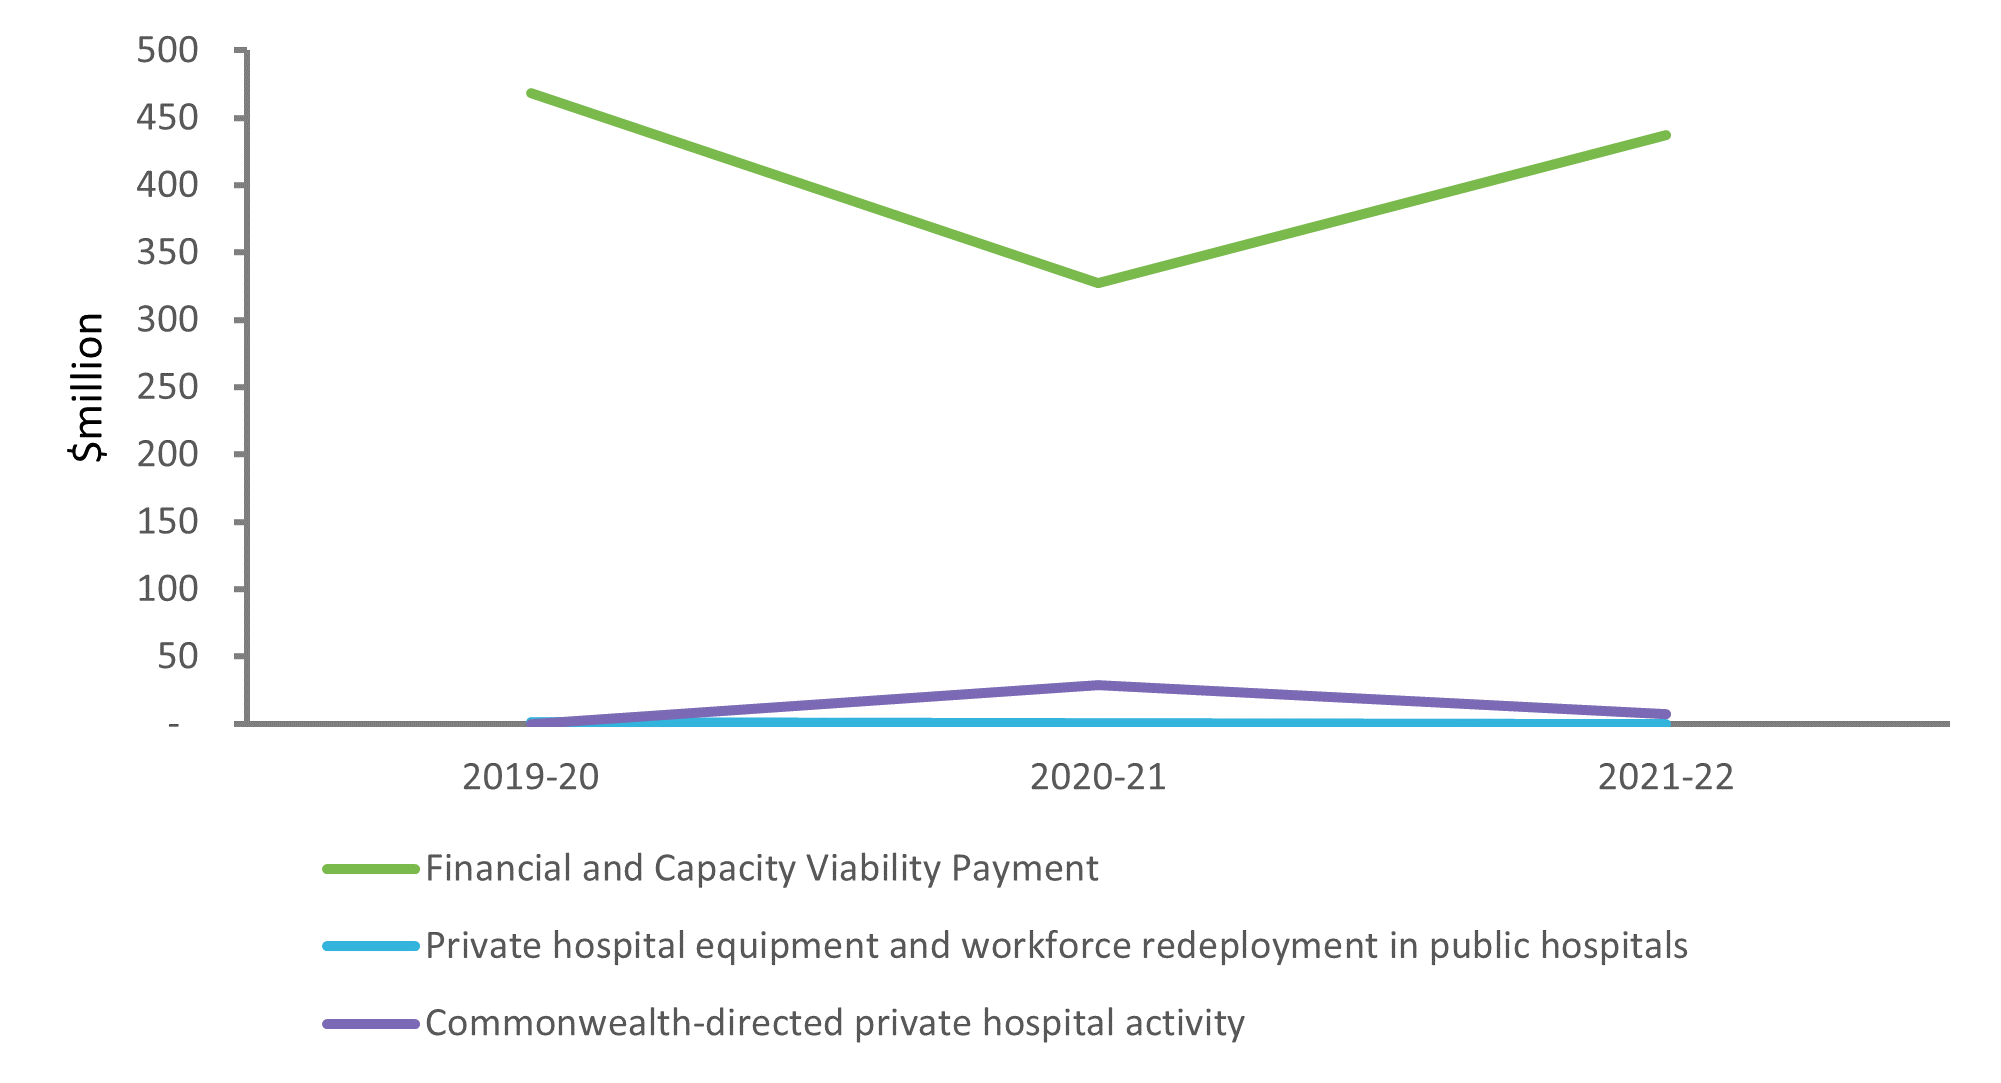
Chart: AIHW
Source: National Health Funding Body.
Notes: The line representing the ’private hospital equipment and workforce redeployment in public hospitals’ is close to the horizontal axis due to its low value compared to other components of FVP.
NPCR payments by jurisdiction
In aggregate over the three financial years of the pandemic (2019–20 to 2021–22), Victoria received the highest NPCR payment of $9.5 billion. NSW received the second highest payment of $8.6 billion. This is consistent with the number of COVID–19 cases and hospitalisations experienced by these jurisdictions. See MyHospitals.
Figure 5: NPCR payments by jurisdiction and funding source, 2019–20 to 2021–22
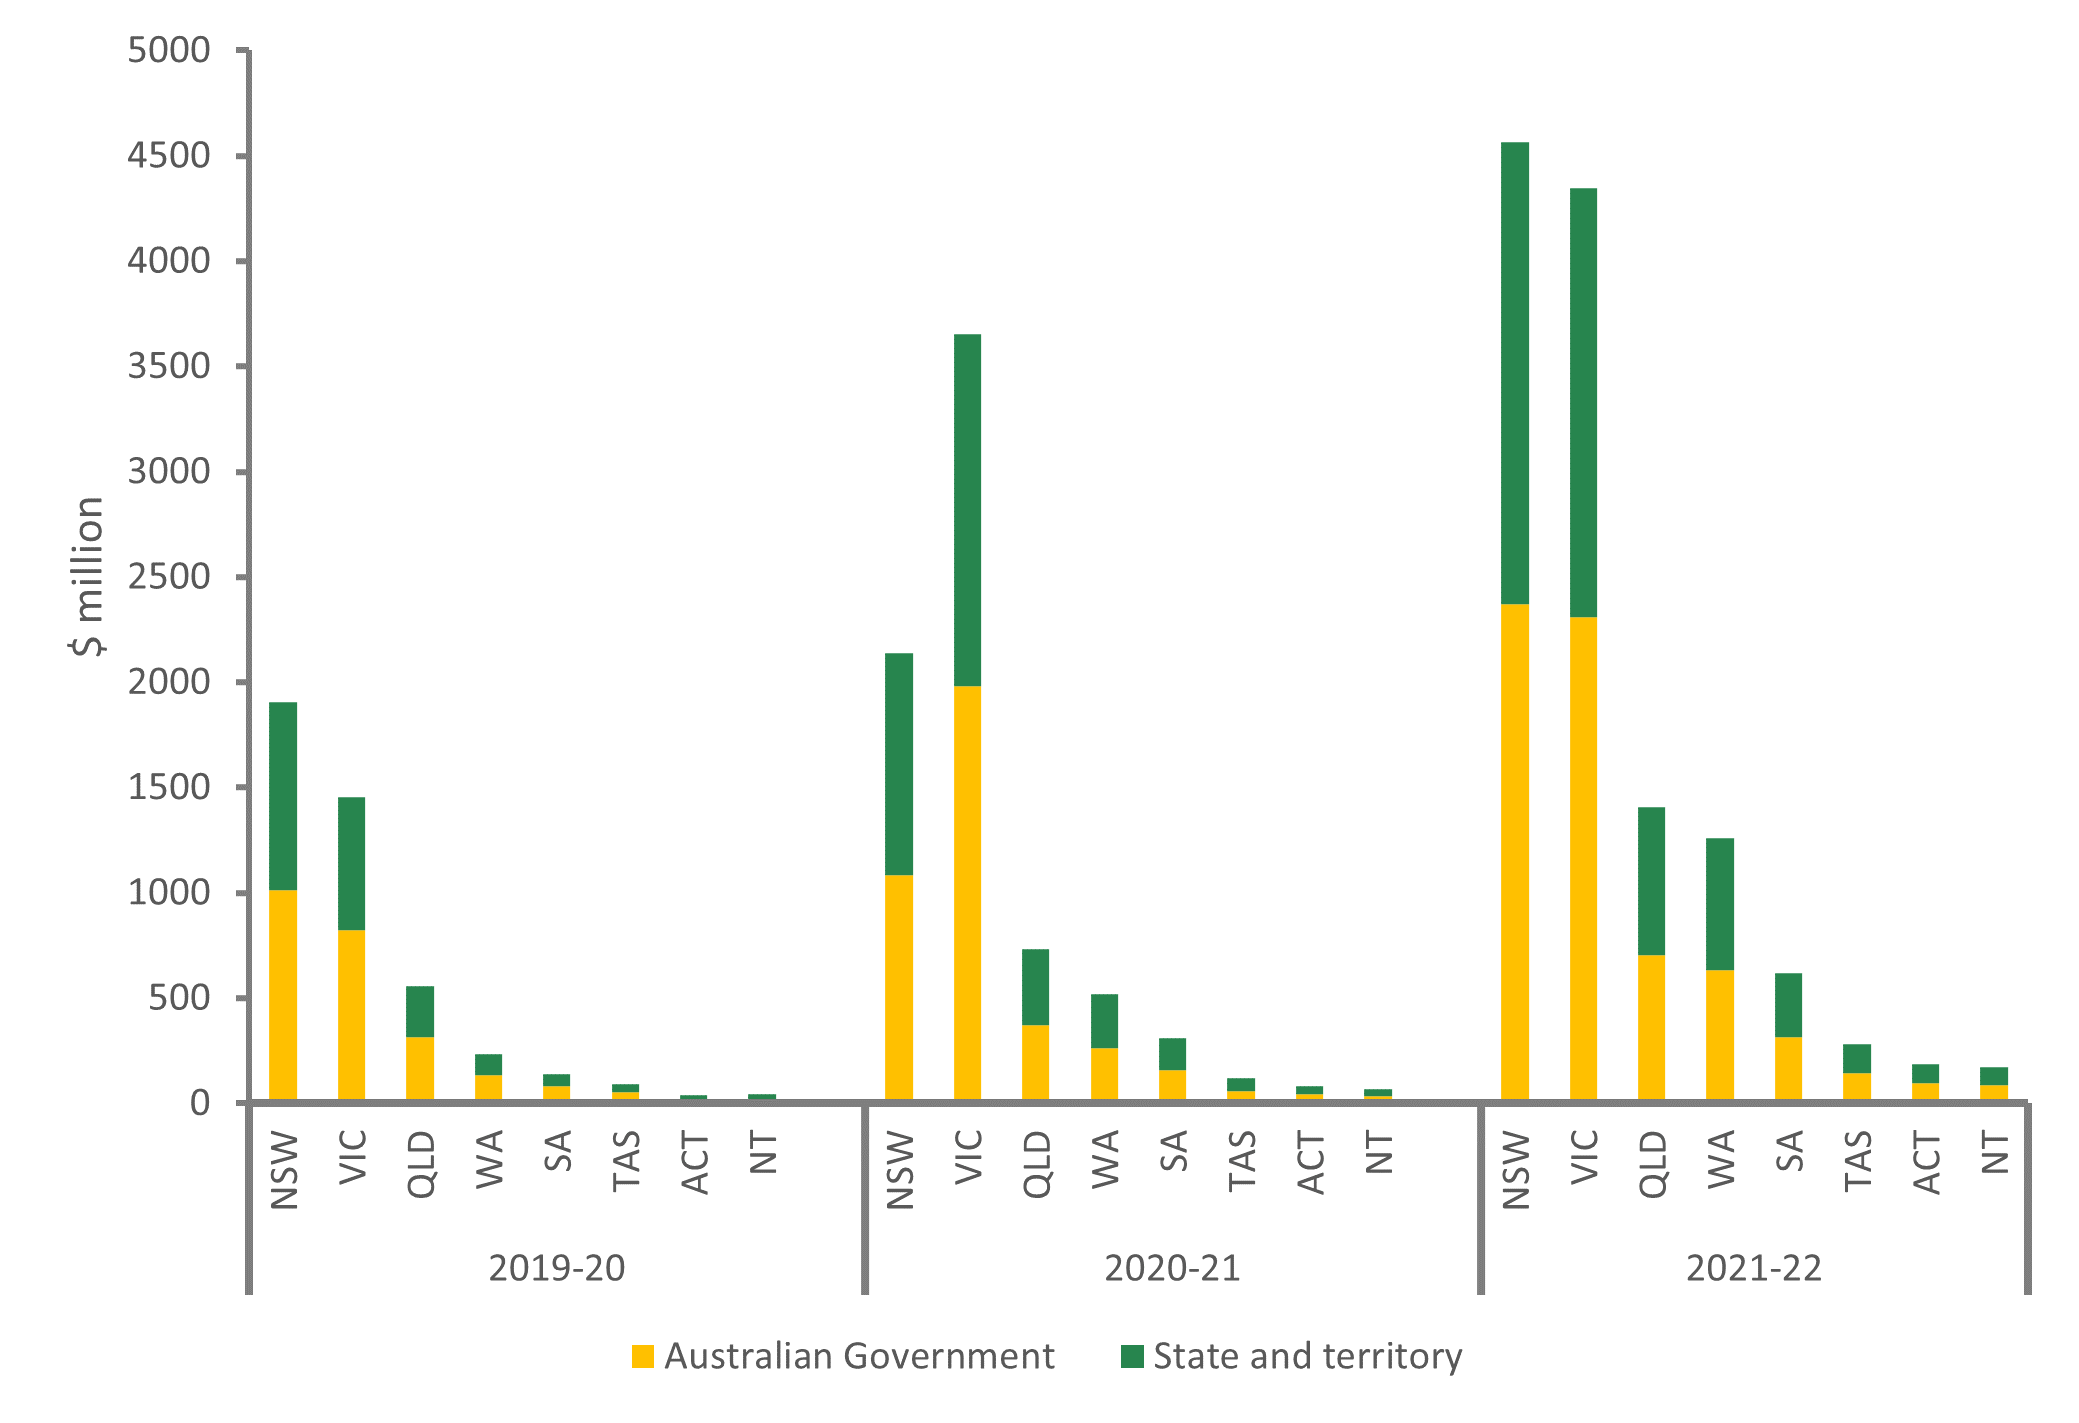
Chart: AIHW
Source: National Health Funding Body
It is important to note that that any spending for COVID–19 by the state and territories outside the NPCR has been excluded from the report as it was difficult to ensure the consistency of reporting between jurisdictions and accurately determine the source of the funding for each jurisdiction.
NPCR payment types by area of spending
Figure 6 shows the NPCR payments of $25 billion over the three main years of the pandemic disaggregated by the areas of expenditure as per the Australian National Health Account.
Figure 6: NPCR payments by area of spending, 2019–20 to 2021–22
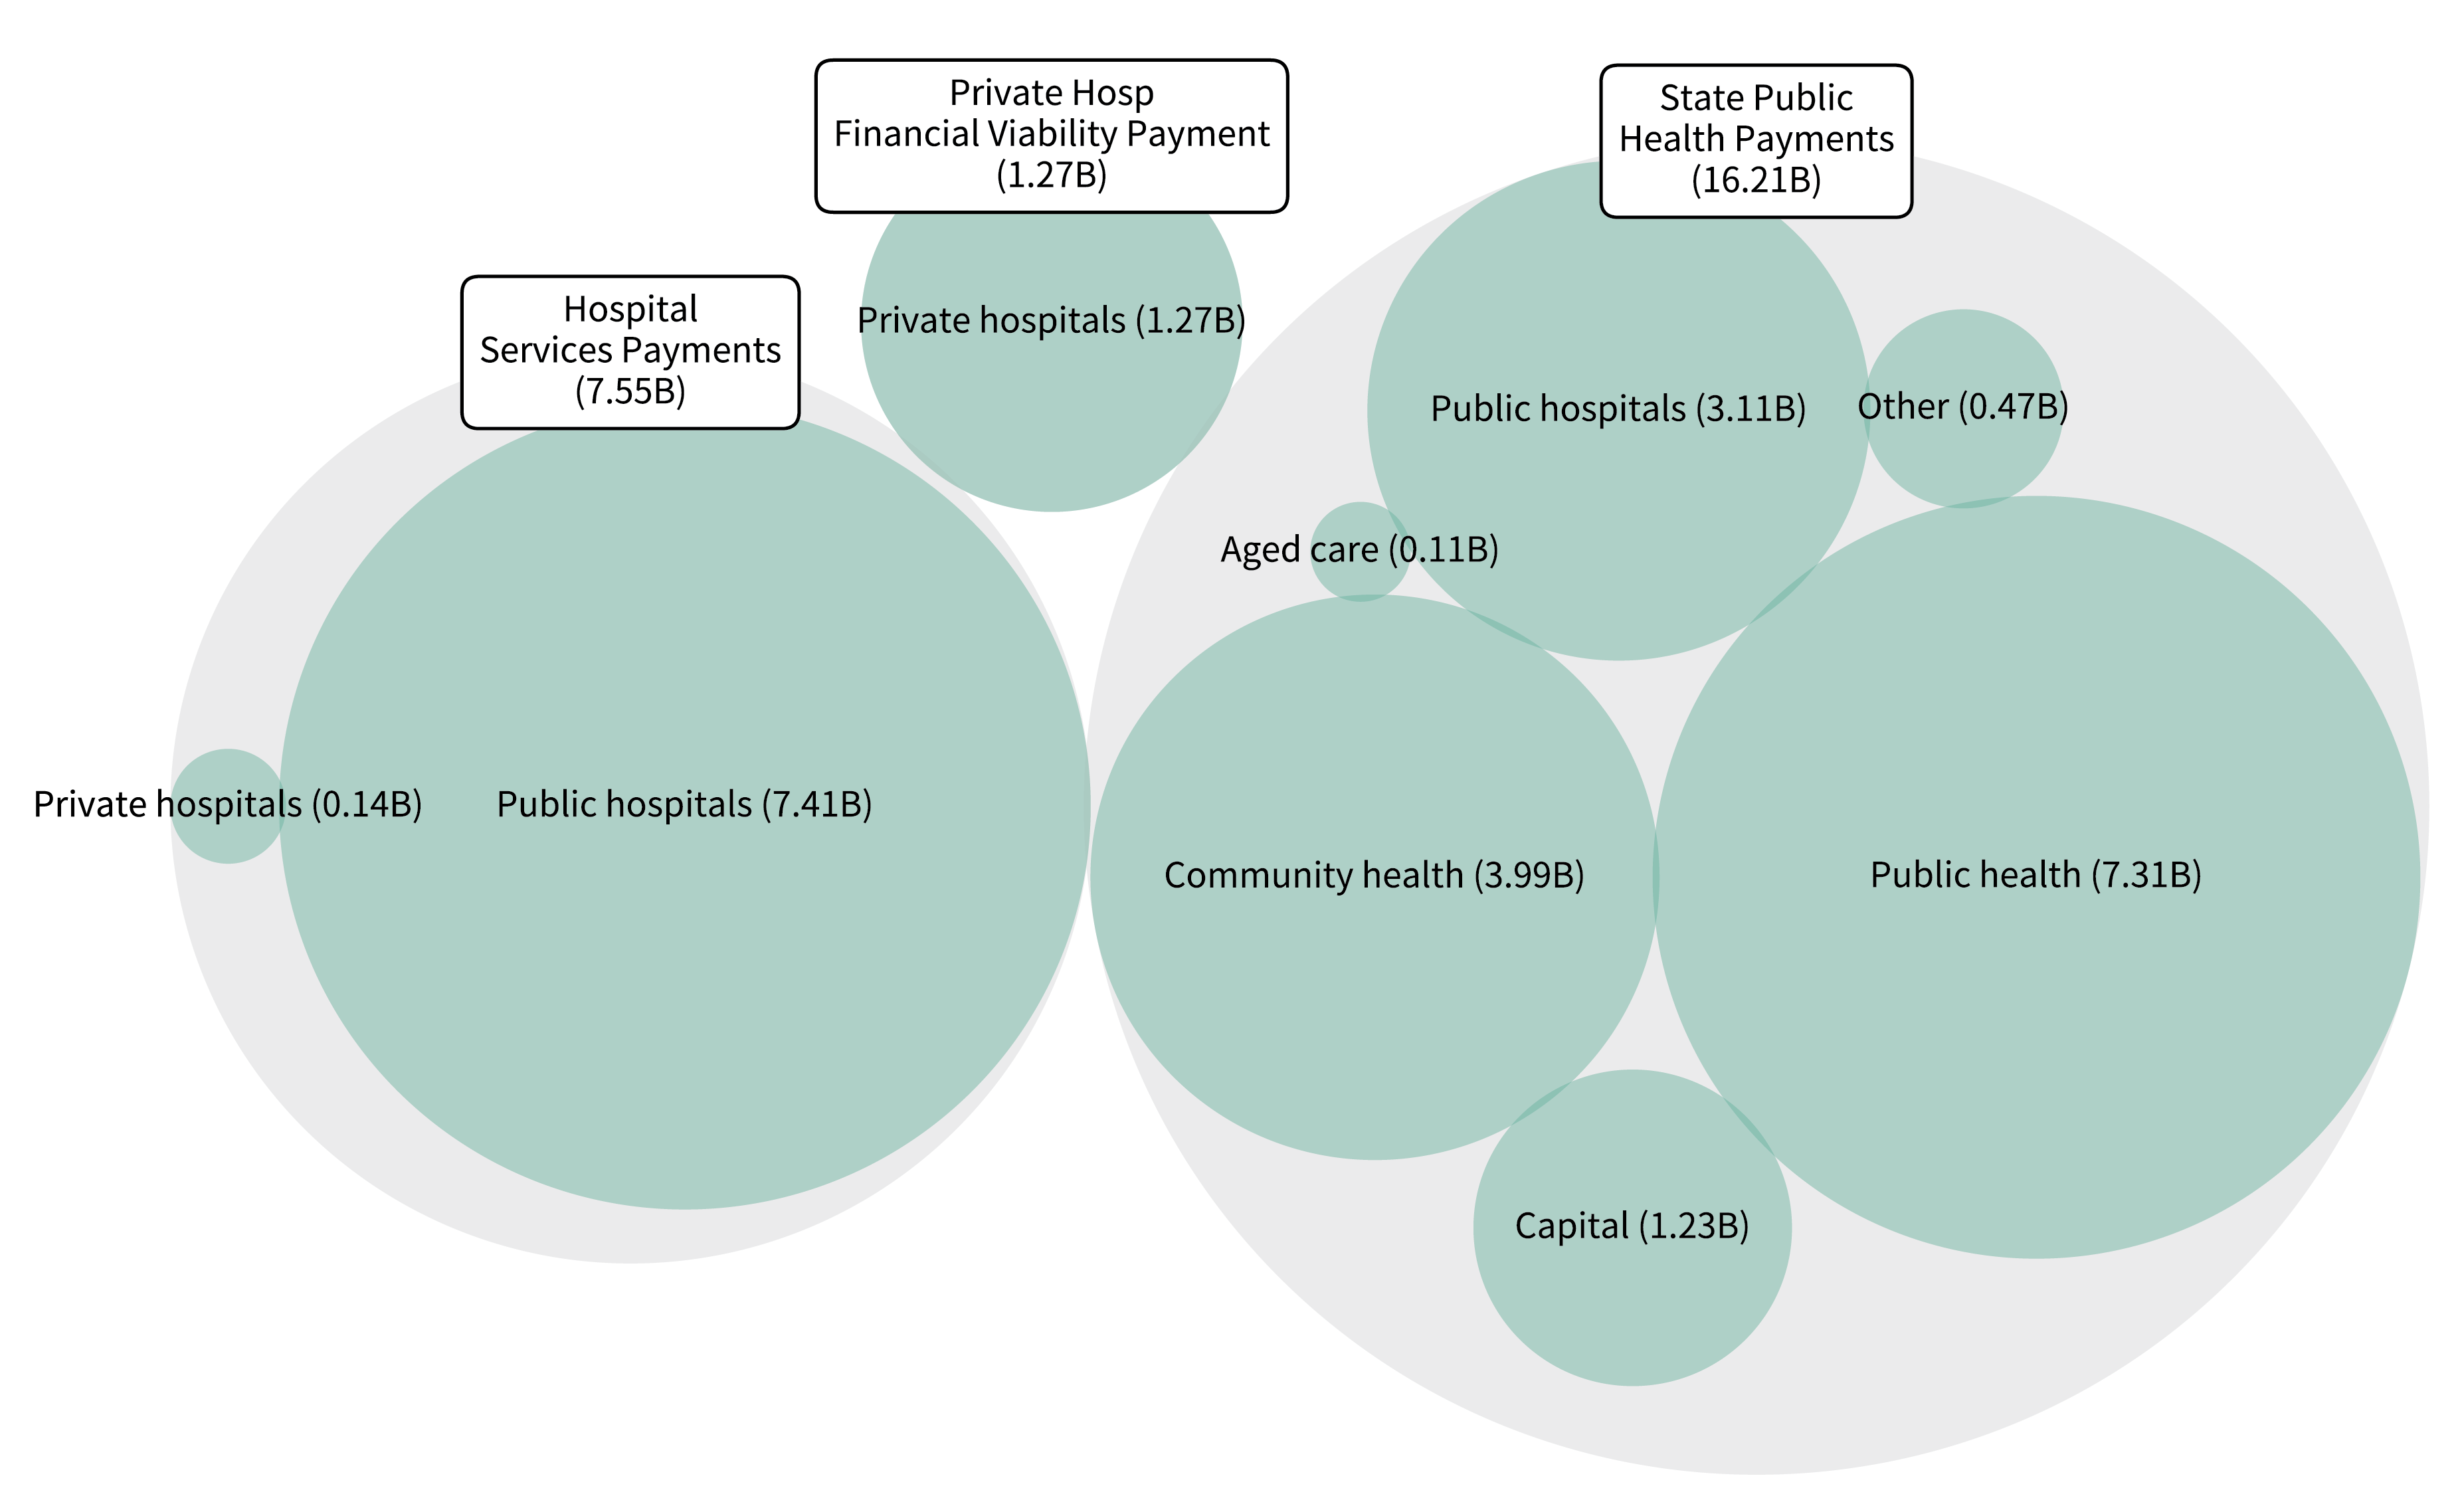
Source: Department of Health and Aged Care.
Australian Government Department of Health and Aged Care
Total Australian Government spending through specific COVID–19 Department of Health and Aged Care programs (outside the NPCR) for the period 2019–20 to 2021–22, was estimated to be $22 billion in current prices. This included $2 billion of health– related spending in the aged care sector. Of the $20 billion spent in the health care sector, $16.6 billion (75.6%) was spent in primary health care. This included:
- $10.8 billion for public health activities including, vaccine response ($5.3 billion), protective and preventive measures ($2.3 billion), rapid antigen test (RAT) subsidies ($0.8 billion), respiratory clinic services ($0.5 billion).
- $0.9 billion on community health services including RAT subsidies ($0.8 billion), mental health and suicide prevention ($0.1 billion).
- $0.2 billion on community health services, almost entirely for mental health and suicide prevention.
- $0.1 billion for pharmaceuticals subsidised through the PBS.
Spending on referred medical services was the next highest area of spending ($2.8 billion). The remaining $538 million was spent on other areas including private hospital services, health administration, capital expenditure and health research. See Data tables.
Figure 7: Dept of Health and Aged Care areas of spending for COVID–19, by year, 2019–20 to 2021–22
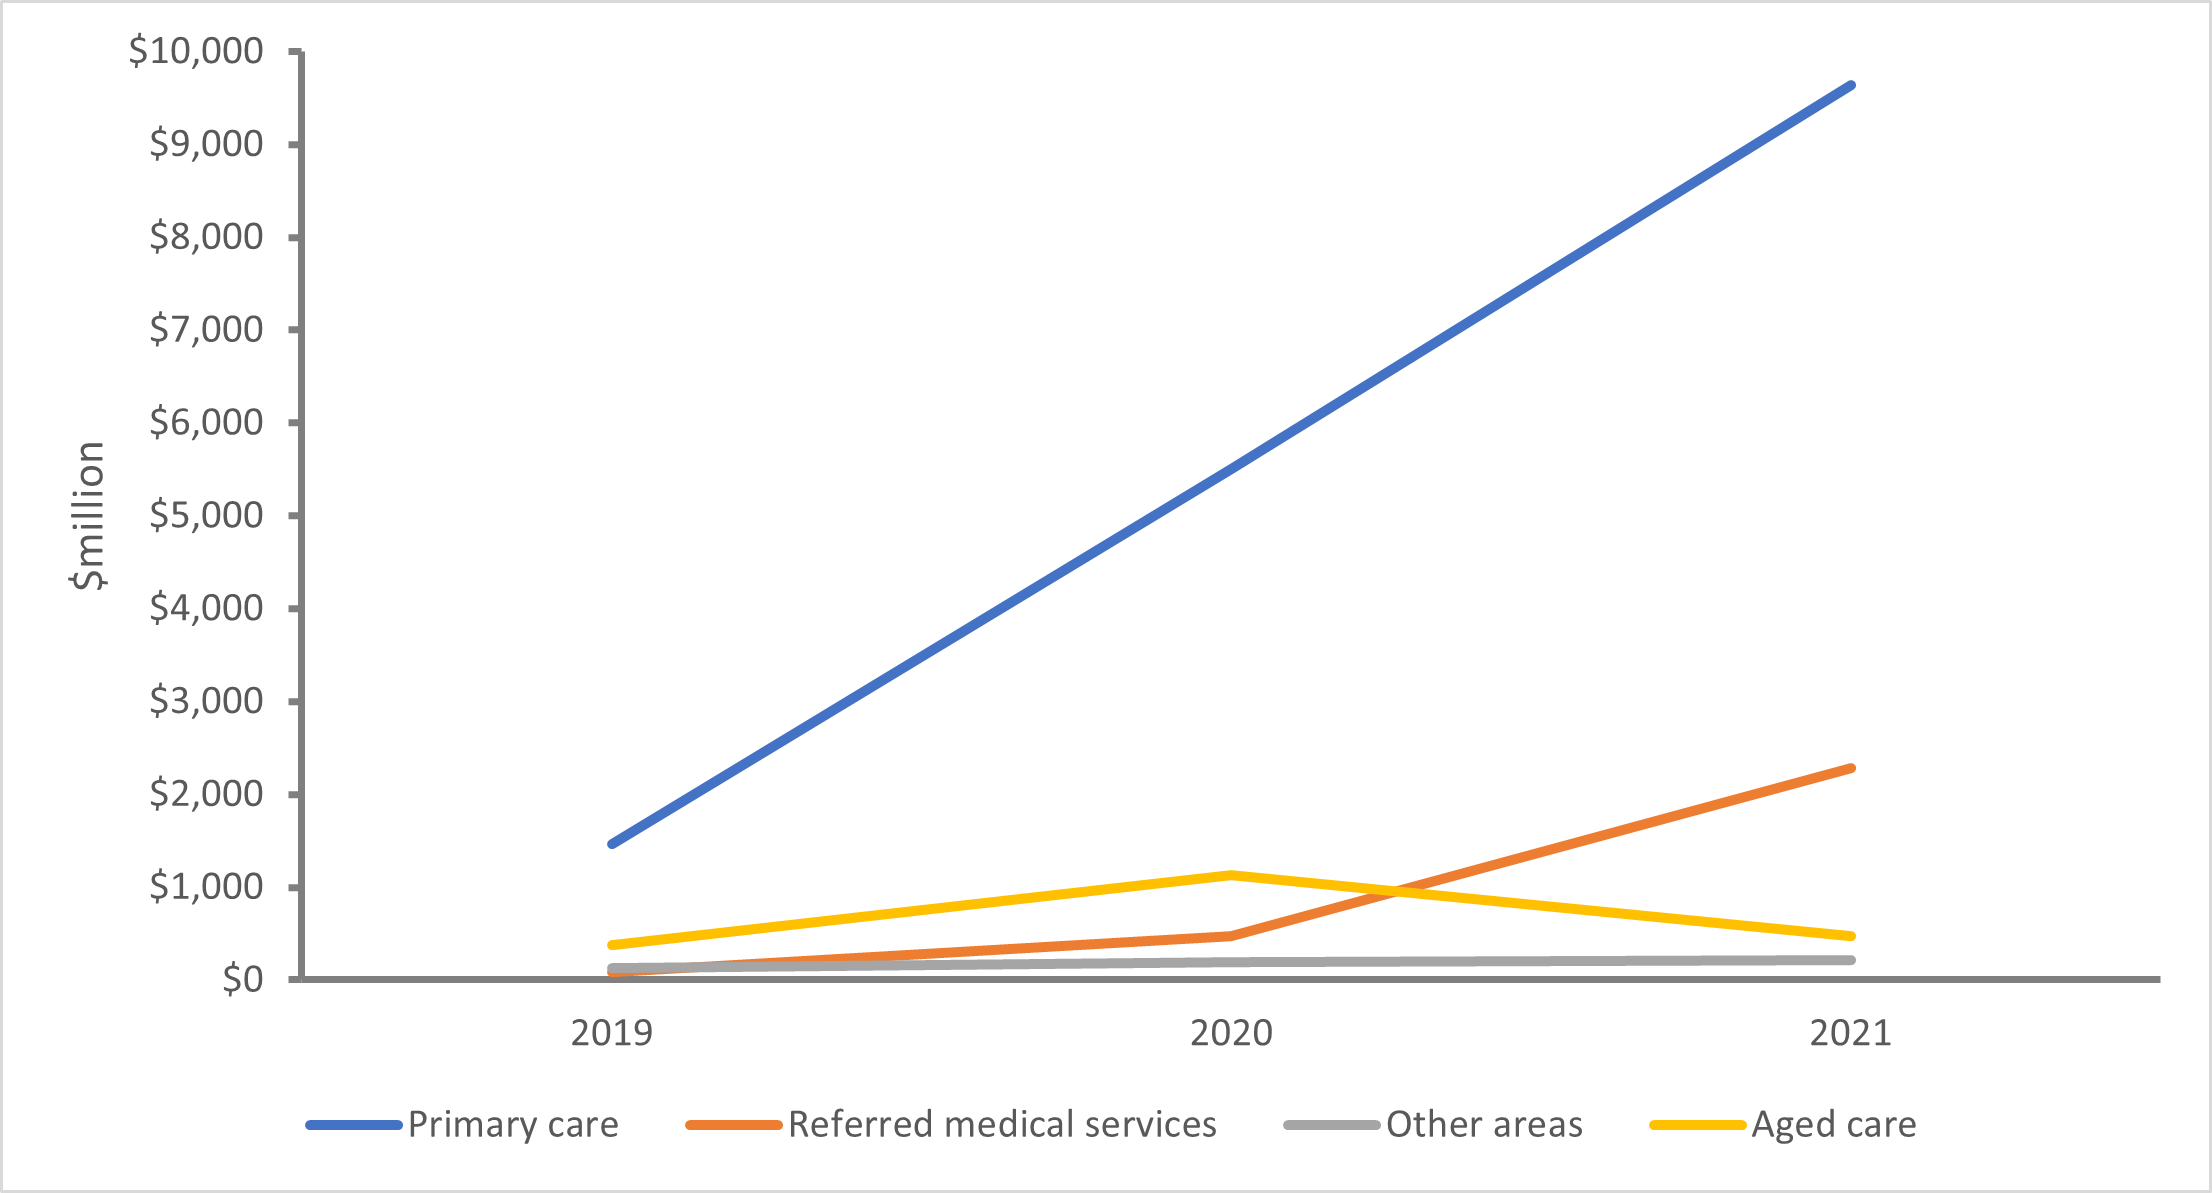
Chart: AIHW
Source: Dept of Health and Aged Care
Australian Government Department of Health and Aged Care payments by outcome and area of spending
Total Australian Government Department of Health and Aged Care spending on the response to COVID–19 over the period 2019–20 to 2021–22 was $22 billion. Figure 8 shows the payments by outcomes, as reported in their 2021–22 annual report, and by the areas of expenditure as reported in the Australian National Health Account.
Figure 8: Dept of Health and Aged Care spending by outcome and area of spending ($22 billion) 2019–20 to 2021–22
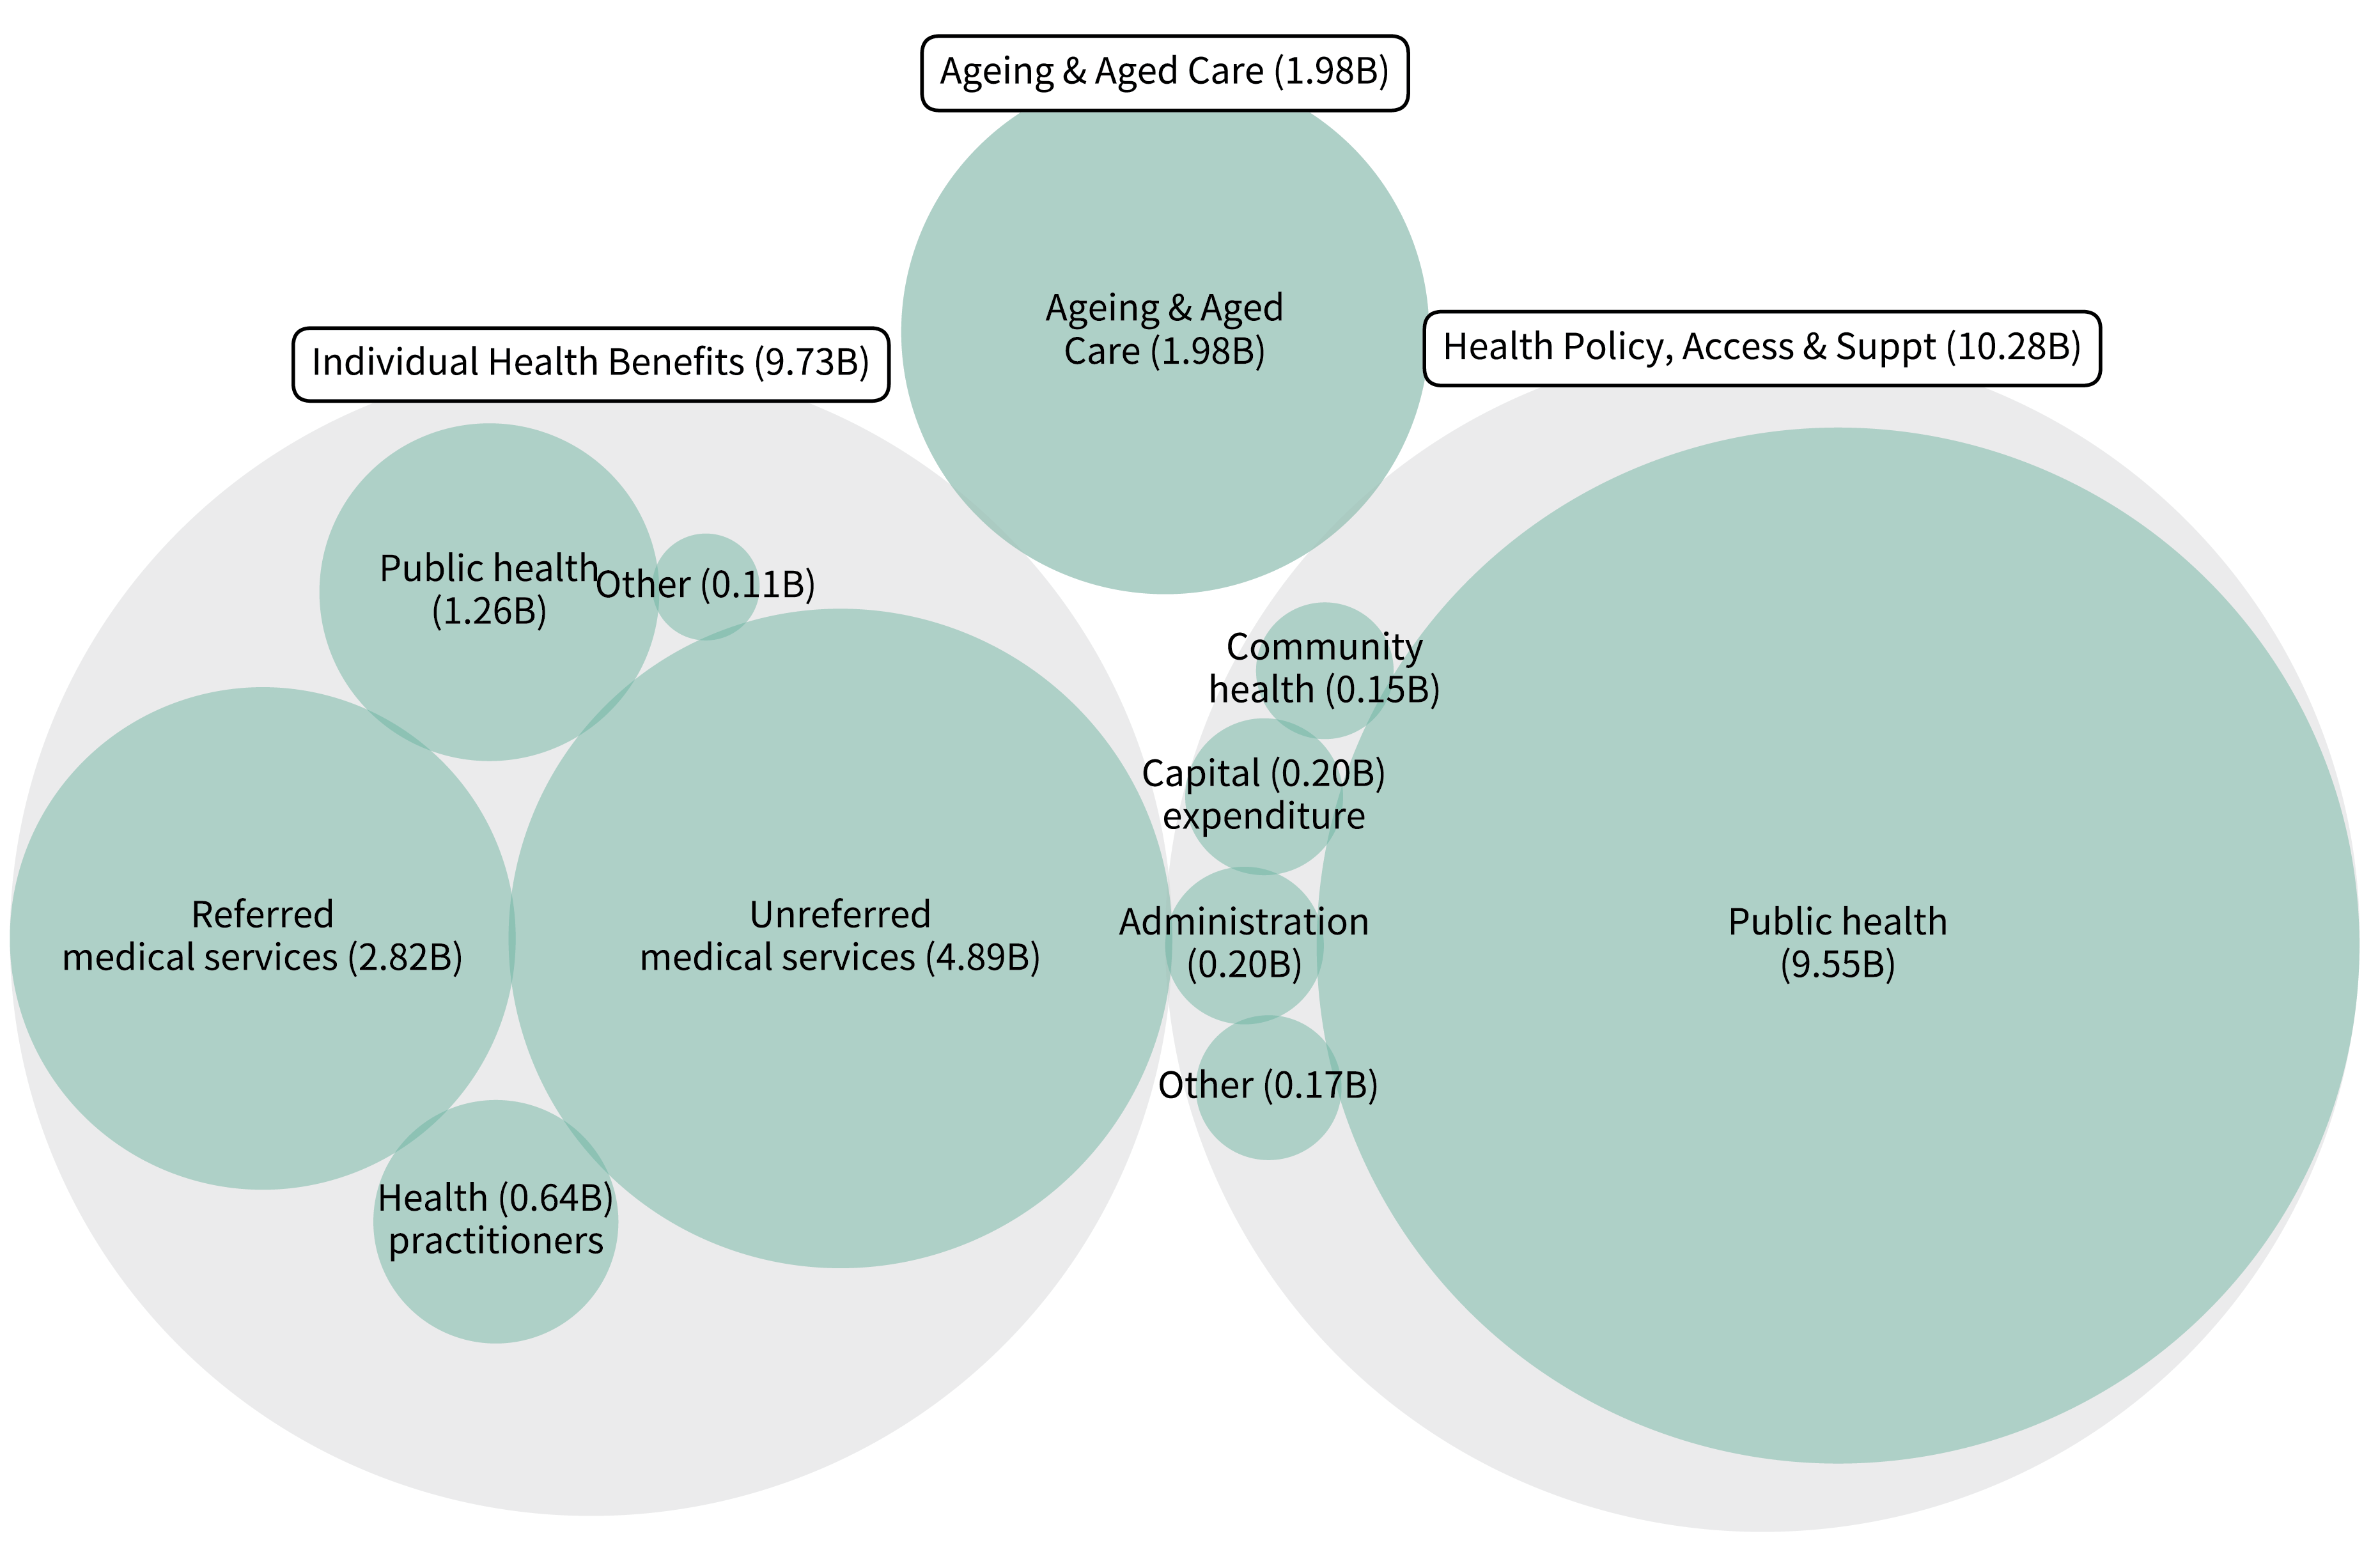 Chart: AIHW
Source: Dept of Health and Aged Care