International comparison
Each country’s experience of the pandemic was different in terms of timing, health impacts and financial impacts. Australia recorded the first confirmed case of COVID–19 virus in January 2020 and since then implemented strict containment measures including border controls, quarantine for returning travellers, and social distancing measures. Various states and territories imposed lockdowns and restrictions as needed.
Australia’s early response helped flatten the curve keeping the number of cases initially low compared to many other countries and continued to be flat during the initial outbreak of Omicron in December 2021(AIHW 2022). Other countries, such as the United States and the United Kingdom, had a much more even distribution of COVID-19 cases across the three years of the pandemic (2020 -2022).
OECD comparison of health system spending during COVID–19
Over the three calendar years most impacted by the pandemic (2020 to 2022), health system spending increased for almost all Organization for Economic Co-operation and Development (OECD) countries compared to the forecast trend. Figure 11, compares the percentage change compared to the trend for each country based on purchasing power parities (PPP) and shows that Australia’s health expenditure was 7% higher than expected, based on a linear forecast of the ten years preceding COVID–19.
What is purchasing power parities (PPPs)?
The cost of health goods and services can vary greatly from one country to another due to differences in price levels. PPPs adjust these costs to a common currency, and a basket of goods and services used for PPP calculations is standardized so that the same set of health goods and services are compared across countries.
Figure 11: Health system spending (PPP) compared to trend, 2020 to 2022
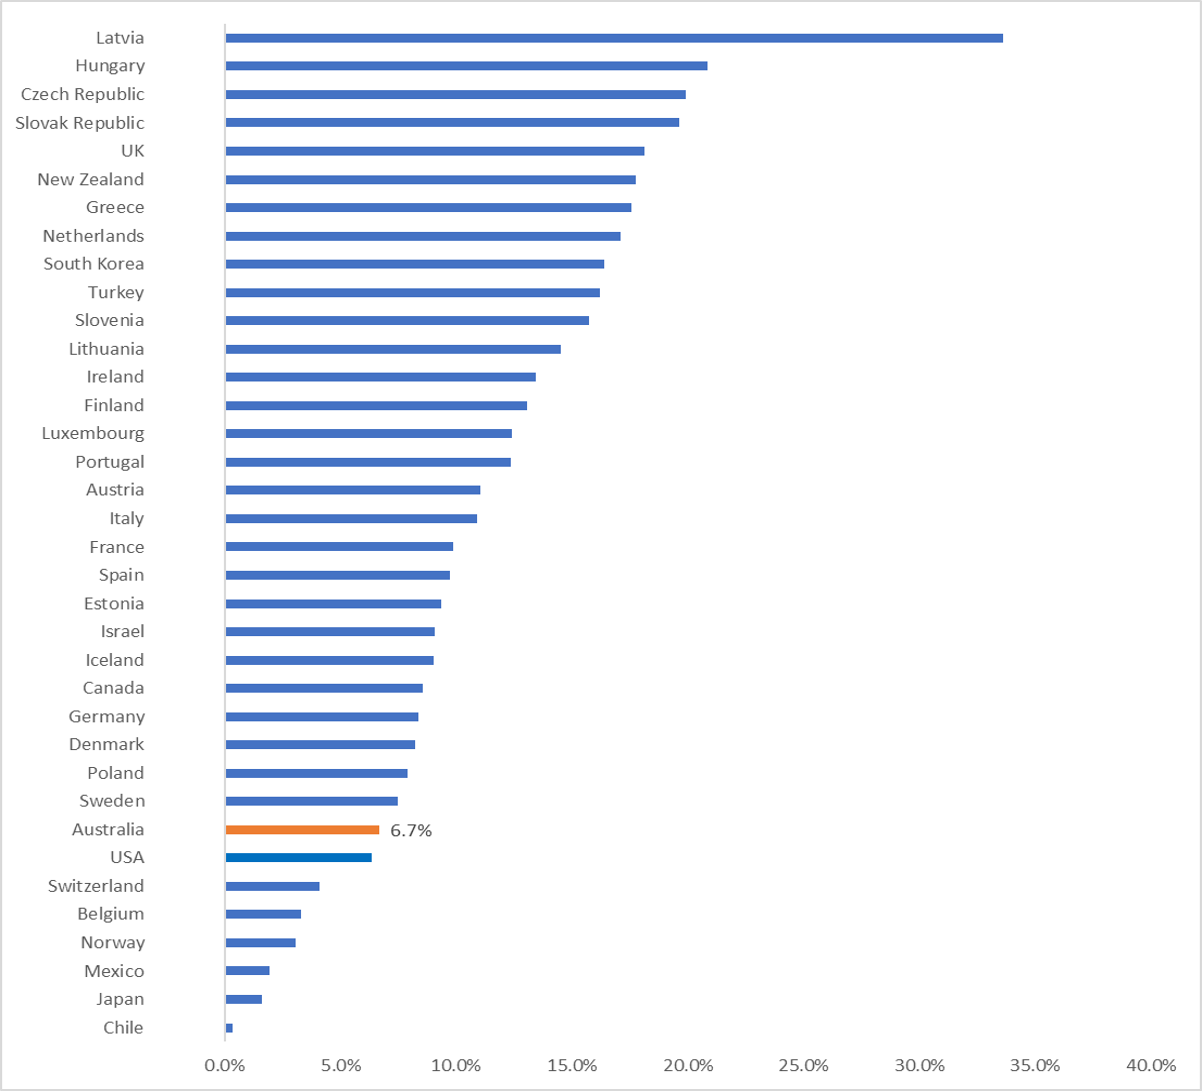
Chart: AIHW
Source: Organization for Economic Corporation and Development (OECD)
Notes: Excludes some OECD countries due to lack of data. Some of the countries in the chart have not reported data across different areas of expenditure.
International comparison of excess mortality
What is excess mortality?
Excess mortality compares the number of deaths recorded for a period against the expected number of deaths over the same period. In this case, the period examined is the three years considered to be most impacted by COVID–19, 2020 to 2022, (though it is acknowledged that the impact continues into 2023). The expected number of deaths is based on the average number of deaths for the previous five years, (2015–19).
While COVID–19 had a major impact on the healthcare and health system spending in Australia, there has been less of an impact on morbidity and mortality than for many other countries (OECD 2021).
Excess mortality is a useful and available measure for the purposes of international comparison of the impact of the pandemic and while a country’s health system spending in response to COVID-19 is likely to have had an impact on excess mortality, there are many other contributing factors, such as geography and social policy, that are beyond the scope of this report.
As shown in Figure 12, Australia ranked 5 in terms of lowest percentage of excess mortality during the pandemic compared to 30 other countries. These countries with a range of health systems and economies were chosen for comparison purpose. Australia’s total excess mortality during the period 2020 to 2022 was 4% higher than the expected mortality, which represents approximately 22,000 extra deaths. Note that this figure is different to what the Australian Bureau of Statistics (ABS) estimated for the same period, which was around 15,000 extra deaths. This is due to different methods used for estimating expected mortality (refer to technical notes).
The excess mortality for these 30 countries combined was 12% during the pandemic, noting that the United States’ impact on the average due to their large number of excess deaths.
Figure 12: Excess mortality rate during the COVID–19 pandemic, 2020 to 2022
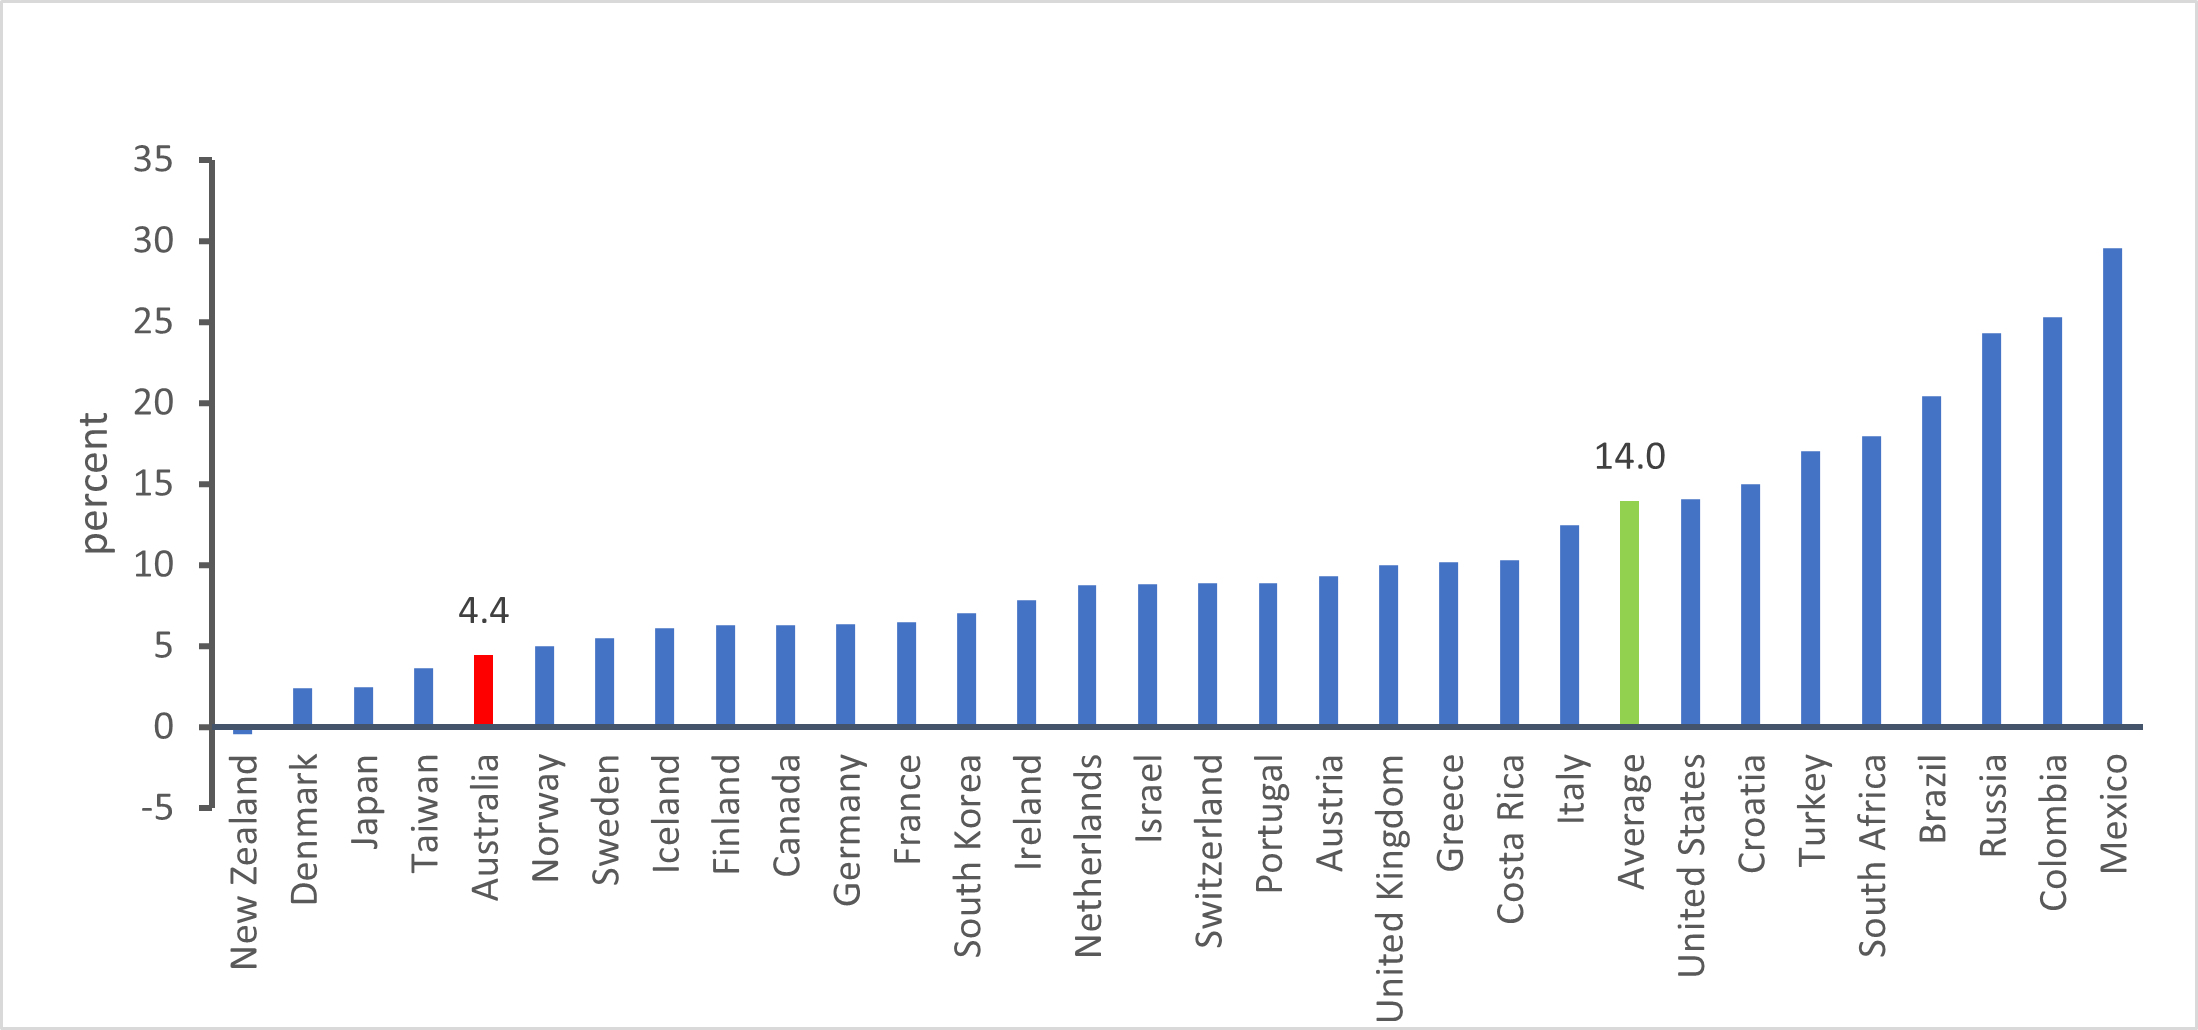
Chart: AIHW
Source: Our world in data
Excess mortality varied by year for each country during the pandemic. Figure 13 below shows that the majority of Australia’s excess mortality occurred during the third year of the pandemic (2022), which was similar to Norway and Japan. Sweden by contrast experienced the majority of its excess mortality during the first year of the pandemic. The United States’ and the United Kingdom’s excess mortality was more evenly distributed over the three calendar years of the pandemic 2020–2022.
Figure 13: Contribution to excess mortality by year, 2020 to 2022
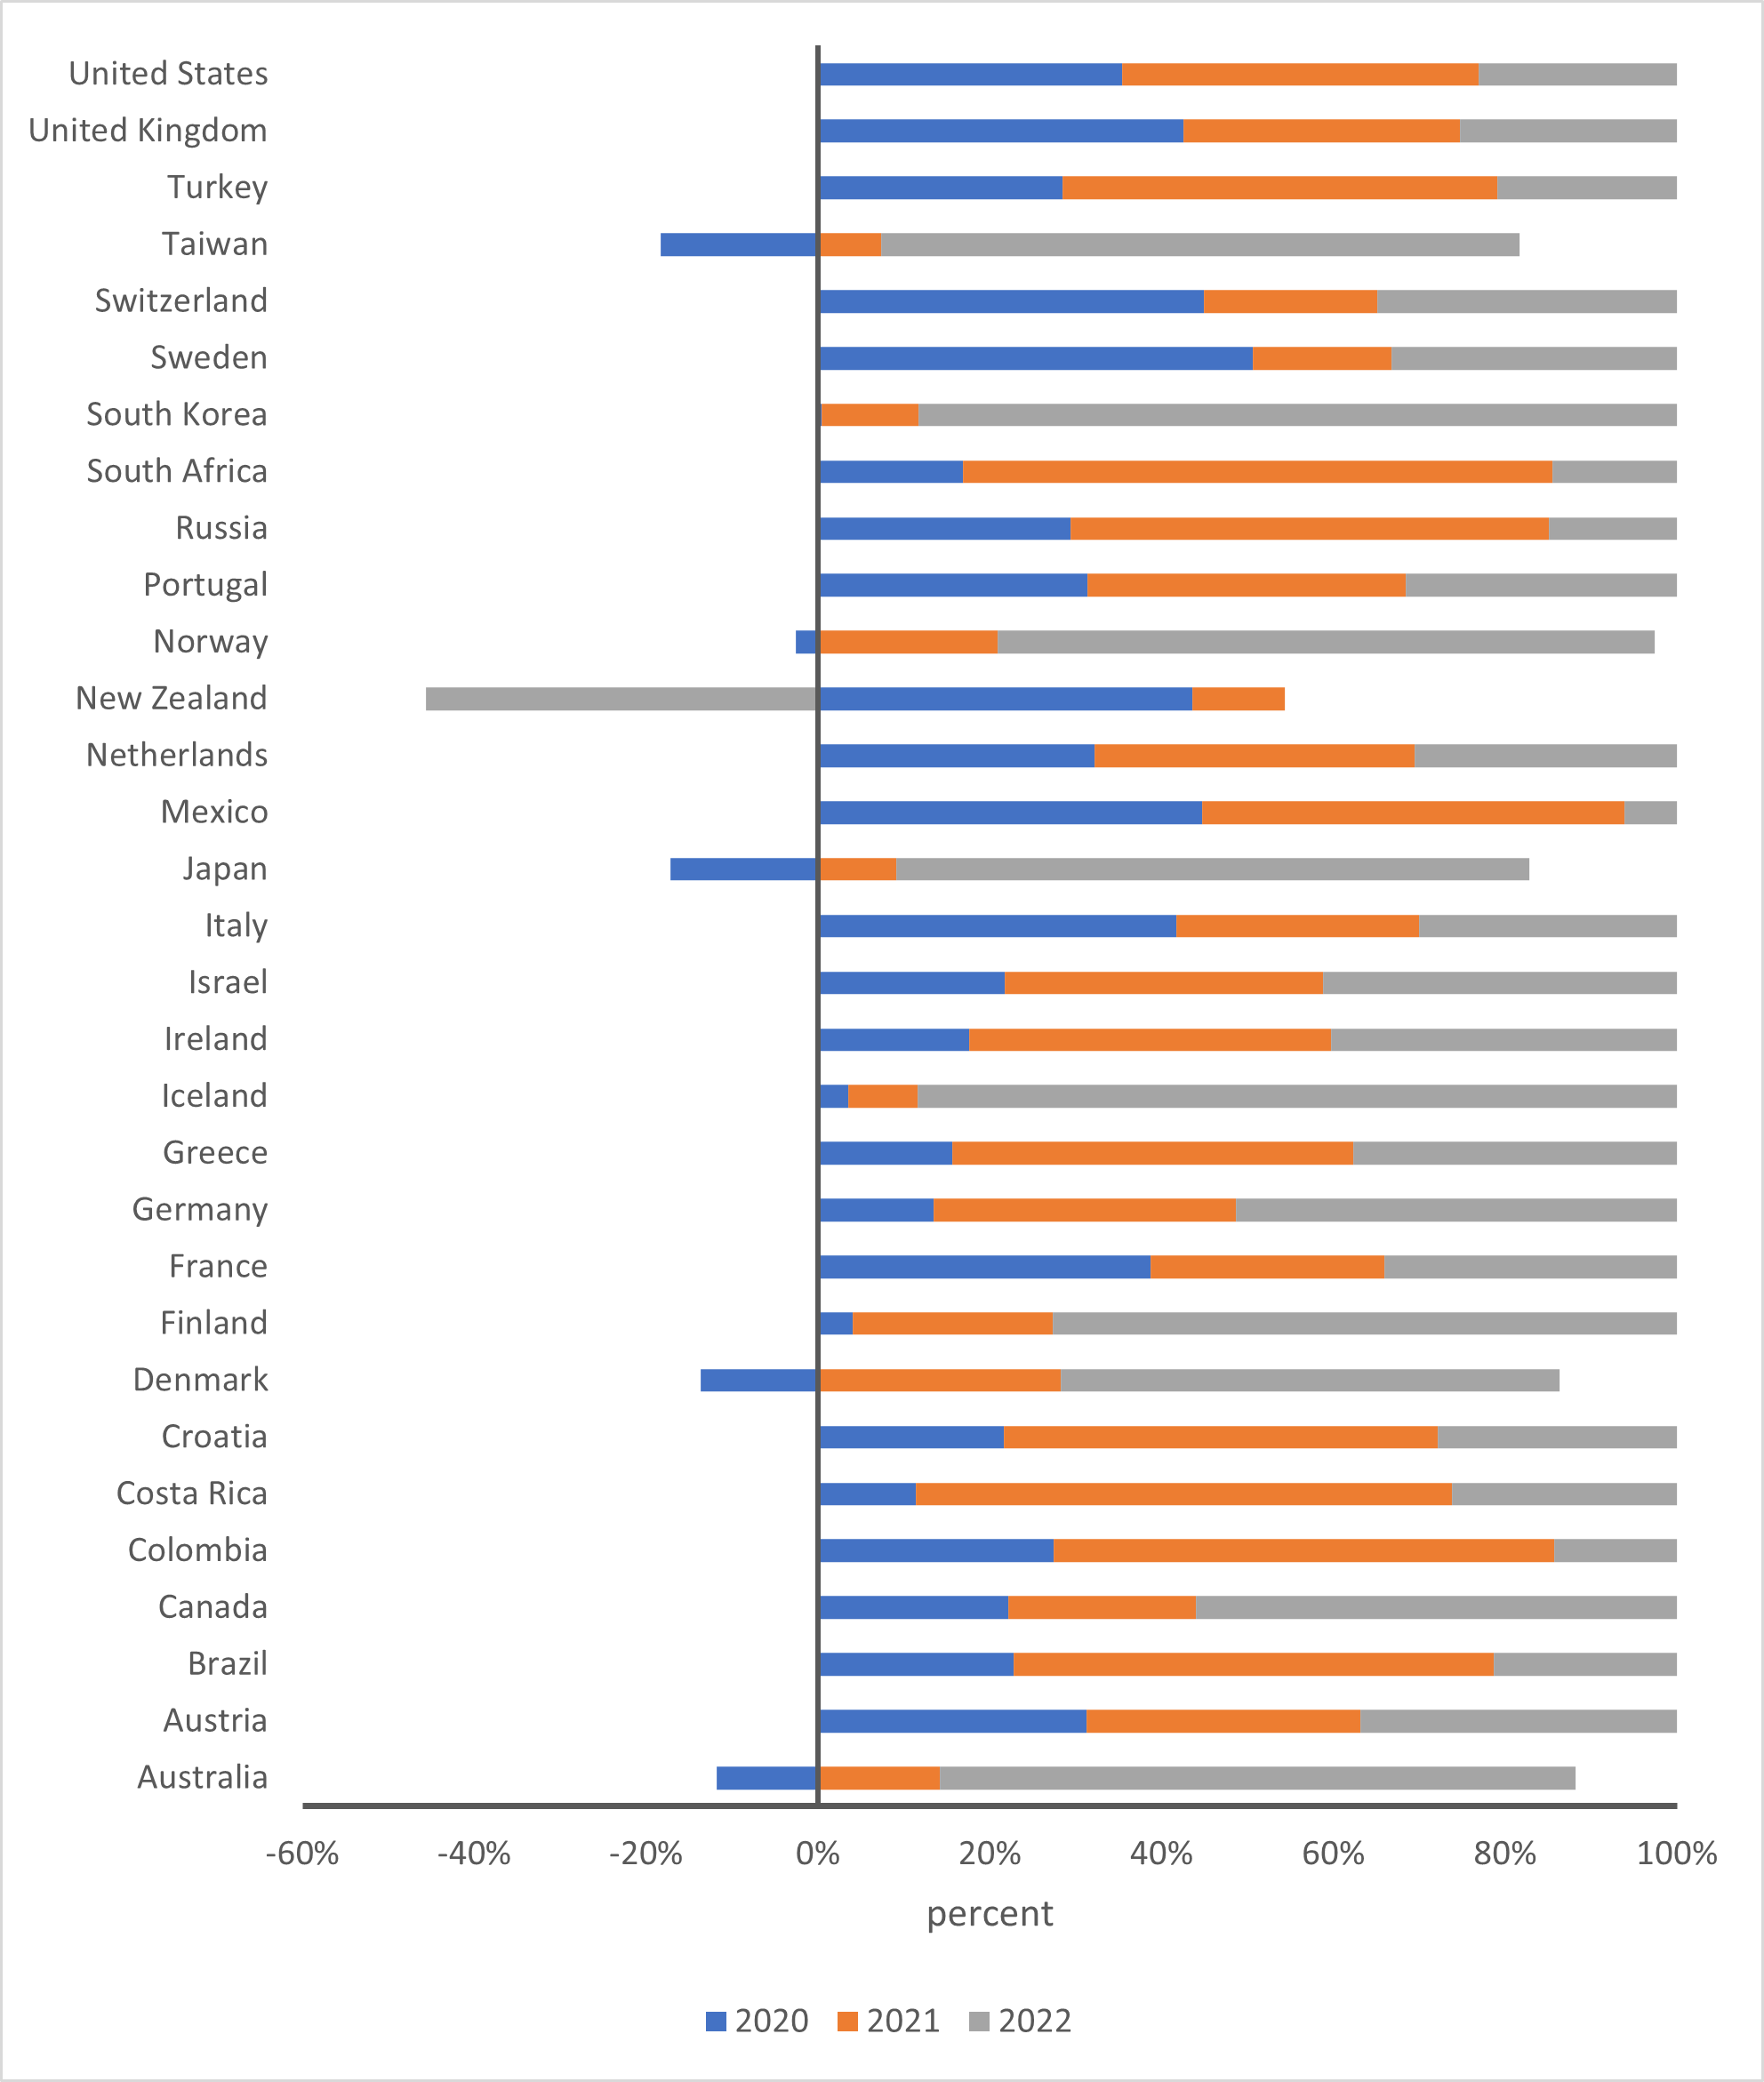
Chart: AIHW
Source: Our world in data
Notes: Australia, Denmark, Japan, Taiwan, Norway and New Zealand had lower than expected deaths in 2020, i.e., negative excess mortality
The global burden of disease results, scheduled for a release update in December 2023, will be another useful measure for comparing the impact of COVID-19 across countries.