Study cohort – Specialist homelessness services: Clients experiencing persistent homelessness in 2019–20

Introduction

A larger share of the homeless population in most countries is homeless for only a short period before finding a more stable housing solution, however, there are a smaller, and  visible share of the homeless population that experiences longer or multiple episodes of homelessness (OECD 2020). See Repeat homelessness for more information about people experiencing repeat cycles of homelessness.

Clients of Specialist Homelessness Services (SHS) experiencing persistent homelessness are defined as those who have been homeless for more than 7 months in the preceeding 24-month period (that is, at least 30% of the time). The number of persistently homeless SHS clients increased from 29,500 clients in 2018–19 to 35,200 clients in 2021–22 (AIHW 2022). Of these clients, 48% experienced persistent homelessness for the first time in 2021–22, while more than half (52%) had experienced persistent homelessness in previous years (AIHW unpublished):

  • 28% experienced persistent homelessness in both the 2020–21 and 2021–22 periods,
  • 11% experienced persistent homelessness in 3 consecutive time periods from 2019–20 to 2021–22,
  • 11% experienced persistent homelessness in 4 consecutive time periods from 2018–19 to 2021–22, and
  • 2% experienced persistent homelessness before but did not experience this for consecutive years.

It is important to note that these results are restricted to people who received support from an SHS agency and their housing situation was only assessed when they were receiving support. The data does not describe all people experiencing homelessness, nor the housing situation of people when they are not receiving SHS support. People experiencing persistent homelessness can cycle in and out of crisis and short term accommodation without reaching a permanent and stable housing outcome.

In 2021–22, overnight accommodation was provided to almost 83,200 SHS clients; over 23,900 (29%) of these clients were experiencing persistent homelessness. Of the 7.8 million total nights of accommodation provided during 2021–22, around 5.0 million (64%) were provided to clients experiencing persistent homelessness in 2021–22 (AIHW unpublished).

Longitudinal analyses have been undertaken for the 2019–20 persistent homelessness cohort (PHL cohort). This cohort was defined as clients who received SHS support at any time during 2019–20, and who:

  • had at least one month of homelessness during July 2019 to June 2020, and
  • were homeless for more than 7 months out of 24 months prior to their last supported month during 2019–20.

The number of clients experiencing persistent homelessness in the pathways study cohort (26,900) was less than the number of persistent homeless clients reported using annual data (30,300) (AIHW 2022). The difference was because the pathway analyses used more stringent quality requirements for client information. Therefore, some clients with less accurate information were excluded from the pathways analyses.

See Introduction to the SHS longitudinal data for details on the longitudinal analyses undertaken.

A comparison cohort (non-persistent homelessness) was created, comprising of clients that received SHS support at any time during 2019–20 and:

  • had at least one month of homelessness during July 2019 to June 2020, and
  • were not homeless for more than 7 months out of 24 months preceding their last supported month in 2019–20.

More information on the how comparison cohorts were derived can be found in the Methodology section.

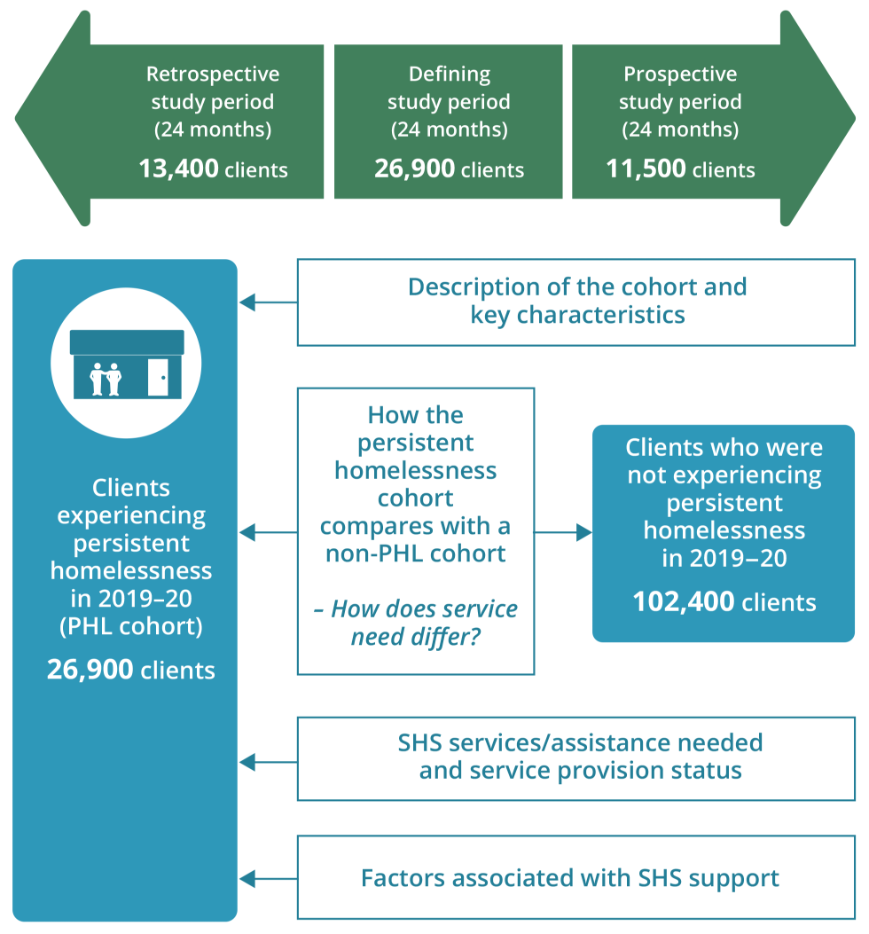
The longitudinal SHS data for the period 2015–22 were used to examine characteristics and service use patterns of the 2019–20 persistent homelessness cohort compared with the 2019–20 non-persistent homelessness cohort (Figure Persistent.1).

The defining study period for these cohorts is the 24 months prior to the last support for each client between July 2019 and June 2020. The retrospective study period is the 24 months before the start of each client’s 24 month defining study period, and the prospective study period is the 24 months after the end of each client’s 24 month defining study period.

Key findings

  • In 2019–20, 56% of clients who experienced persistent homelessness were female and 51% were under 25 years old.
  • Around half (51%) of the persistent homelessness cohort had been couch-surfing and one-third (33%) were rough sleeping at some time during the defining period.
  • In 2019–20, clients experiencing persistent homelessness were around 4 times more likely to need assistance for physical disability services compared with the non-persistent cohort.
  • The persistent homelessness cohort were more likely to receive accommodation (of any type) (74%) compared with the non-persistent cohort (47%), especially medium-term accommodation.

Figure Persistent.1: Clients experiencing persistent homelessness cohort, longitudinal analysis overview

The infographic shows how the longitudinal analysis for the 2019–20 PHL cohort are structured and how the cohort and study periods are defined. The 2019–20 PHL cohort was defined as clients who received SHS support at any time during 2019–20, and who had at least one month of homelessness during July 2019 to June 2020, and were homeless for more than 7 months out of 24 months prior to their last supported month during 2019–20. For this analysis, the defining study period for these cohorts is the 24 months prior to the last support for each client between July 2019 and June 2020. The retrospective study period is the 24 months before the start of each client’s 24 month defining study period, and the prospective study period is the 24 months after the end of each client’s 24 month defining study period. The analysis for these cohort clients included, a description of the cohort and key characteristics/vulnerabilities, SHS services/assistance needed and service provision status for PHL cohort clients, a comparison between the PHL and non-PHL cohort, PHL cohort client characteristics associated with SHS support in the past and future.

Key characteristics of the 2019–20 persistent homelessness cohort

Almost 26,900 SHS clients experienced persistent homelessness in 2019–20; during the defining study period, these clients had the following characteristics (Figure Persistent.2, Table PHL1920.1, Table PHL1920.2):

  • A majority (56% or 15,100 clients) were female.
  • Around half (51% or 13,600 clients) were under 25 years old.
  • Almost one-third (32% or 8,500 clients) were Indigenous Australians.
  • Around half (51% or 18,800) had been couch-surfing at some time during the defining period and one-third (33% or 8,800) were rough sleeping at some time during the defining period.
  • Around half of the clients (50% or 13,400 clients) had received SHS support previously (in the 24-month retrospective period) and 43% (11,500 clients) continued to need support in the 24-month prospective period.
  • Over half (55% or 14,800 clients) had 3 or more SHS periods of support during the defining study period, 19% had two support periods and 26% had only one support period.
  • Around one in ten (9.5% or 2,600 clients) had exited a foster care/child safety placement or other care institution.
  • Three-quarters (74% or 19,800 clients) had received accommodation in the defining period (of any type, short, medium or long-term).

Figure Persistent.2: Persistent homelessness cohort 2019–20, client key characteristics, by study period

This interactive bar chart shows a comparison between the PHL and non-PHL cohorts, in terms of key characteristics and across all study periods (defining, retrospective and prospective). A radio button allows selection for the individual state/territory and Australia. For Australia, PHL clients were more likely to have problematic drug or alcohol issues (PHL clients 28% compared with 16% non-PHL clients) and mental health issues (56% compared with 40%). They were less likely to have one support period (26% compared with 45%) and more likely to have three or more support period (55% compared with 32%). PHL clients were also more likely to receive accommodation (of any type) (74% compared with 47%).

Visualisation not available for printing

Notes:

  1. Counts of clients with values of No include cases where the variable is not stated or unknown.
  2. Clients are counted as Indigenous or overseas-born if they are classified as such in any support period in the longitudinal data.
  3. Percentages are calculated using total clients within the cohort as the denominator (Persistent cohort: 26,887, non-persistent cohort: 102,383). For the retrospective and prospective study periods the percentages may not add to 100 as not all cohort clients are included in these periods.
  4. Received accommodation indicates that the client was provided either short-term or emergency accommodation, medium term/transitional housing, or long-term housing.
  5. Short-term clients received SHS services only during the defining study period. Historical clients received SHS services in the retrospective and defining study periods. Ongoing clients received SHS services in the defining and prospective study periods. Long-term clients, received SHS services in all three study periods.
  6. Reason refers to the reasons a client presented to any specialist homelessness services agency during the study period.
  7. The variable Ever Presented Alone refers to whether a client was ever recorded as having presented for support (that is, started a support period) alone. Unlike many other variables, this is only recorded in the SHS data at the start of support periods. Counts of clients with values of No include cases where the variable is not stated or unknown. Note: for children, there may be instances where the child physically presented with an adult to an agency, but only the child required and received SHSC services, or where the child was not correctly linked to the group when the support period was opened.
  8. The variable Presented with child(ren) indicates whether the client presented for support (that is, started a support period) as part of a group which contained one or more children.

Source: AIHW analysis of SHS longitudinal data 2015–22, Table PHL1920.1.

Service engagement profiles

SHS support patterns over the longitudinal period 2015–22 were examined for clients experiencing persistent homelessness in 2019–20 (Figure Persistent.3, Table PHL1920.1, Table PHL1920.2).

Short-term clients received SHS services only during the defining study period.

Historical clients received SHS services in the retrospective and defining study periods.

Ongoing clients received SHS services in the defining and prospective study periods.

Long-term clients received SHS services in all three study periods.

  • Over a quarter (27% or 7,300 clients) of the 2019–20 PHL cohort were long-term clients, receiving support in all three study periods.
  • Around a third (35% or 9,300 clients) were short-term clients receiving services only during the 24-month defining study period.
  • 23% (6,100 clients) were historical clients who were supported in the retrospective and defining periods, and 16% (4,200 clients) were ongoing clients who were supported in the defining and prospective periods.

Figure Persistent.3: Persistent homelessness cohort 2019–20, service engagement profiles

This interactive bar chart shows service use patterns of the 2019–20 PHL cohort over the 2015–22 longitudinal period. Support information was combined from the discrete study periods into four service engagement profile groups (historical, short-term, long-term and ongoing). Engagement profiles for all states and territories and Australia can be selected and displayed. Nationally, of the 26,900 clients that made up the defining period cohort, 9,300 (35%) were short-term clients who only received support during the 24-month defining study period and 7,300 (27%) were long-term clients and had received support in all three study periods.

Visualisation not available for printing

Note: Short-term clients received SHS services only during the defining study period.  Historical clients received SHS services in the retrospective and defining study periods. Ongoing clients received SHS services in the defining and prospective study periods. Long-term clients received SHS services in all three study periods.

Source: AIHW analysis of SHS longitudinal data 2015–22, Table PHL1920.1.

Vulnerability pathways

Using data for the period 2015–22, client profiles for the persistent homelessness cohort were examined for the presence of vulnerabilities including a current mental health issue, problems with drug and/or alcohol, and experience of family and domestic violence (FDV) within each of the 3 study periods – the retrospective, defining and prospective periods (Figure Persistent.4, Table PHL1920.1, Table PHL1920.3). For more information on the derivation of these vulnerabilities, see Methodology.

During the defining period, the most common vulnerability among the 2019–20 persistent homelessness cohort was having mental health issue (15,000 clients). Of these clients, 38% (5,700 clients) received support and had mental health issues in the retrospective period;  34% (5,100 clients) received support and has a mental health issue in the prospective period.

Figure Persistent.4: Persistent homelessness cohort 2019–20, vulnerability pathways

This interactive Sankey diagram shows the 2019–20 PHL cohort clients who experienced three vulnerabilities, clients who had experienced FDV, clients with a mental health issue and those with problems with drugs or alcohol in the defining study period and whether clients also experienced these vulnerabilities in the past and future study periods. These vulnerability pathways are shown separately, using radio buttons to select between vulnerability types. Using data for the entire longitudinal period, SHS PHL cohort clients were assessed for the presence of these vulnerabilities within each of the three study periods – the retrospective, defining and prospective periods. Vulnerability data and pathways for all states and territories and Australia can be selected and displayed. Most clients at the national level only experienced the vulnerability in the defining study period and were not SHS clients in the retrospective and prospective study periods. The second largest category were clients who had experienced the vulnerability in all three periods (past, defining and future).

Visualisation not available for printing

Notes

  1. Percentages are calculated using total clients who experienced the selected vulnerability in the defining period as the denominator (Family and domestic violence: 13,447, Mental health issues: 14,961, Problematic drug/alcohol use: 7,457).
  2. The defining study period covered 24 months prior to the last day of their last support period during 2019–20. The prospective period for this cohort was 24 months (that is, the 24 months after the last day of the client’s last support period in 2019–20). The retrospective study period for each client ranged for the 24 months before the defining period started.

Source: AIHW analysis of SHS longitudinal data 2015–22, Table PHL1920.3.

SHS services needed by clients experiencing persistent homelessness

Service need and service provision/referral was examined for clients who experienced persistent homelessness in 2019–20. Aggregation is based on services needed or provided/referred in support periods that commenced within each study period only.

Patterns of service needed were generally similar across the 3 study periods, except for assistance for training/employment and the associated services (for example, training assistance, educational assistance, employment assistance, assistance to obtain/maintain government allowance), which were greater in the defining period (Figure Persistent.5; Table PHL1920.1, Table PHL1920.4). It is worth noting that the cohort of clients experiencing persistent homelessness in 2019–20 all experienced persistent homelessness during the defining period, however, not all of them experienced the same housing pattern in the retrospective or prospective periods.

Figure Persistent.5: Clients experiencing persistent homelessness in 2019–20, select top 10 services and assistance needed and service provision status by study period

The interactive stacked horizontal bar graph shows the select top 10 services needed and the provision/referral status for the 2019–20 PHL cohort clients (26,900 clients) who received support in the retrospective, defining and prospective study periods. Across all study periods, medium-term or transitional housing was one of the most needed services, around 69% of these clients were either provided this service or referred to another agency. Material aid/brokerage was also a key service needed by this cohort; this service was provided/referred to over 97% of clients.

Visualisation not available for printing

Notes

  1. Percentages are based on the number of clients who needed the service in each study period as the denominator.
  2. Any accommodation assistance  refers to need or provision of any of short-term or emergency accommodation, medium term/transitional housing, long-term housing, assistance to sustain tenancy or prevent tenancy failure or eviction, assistance to prevent foreclosures or for mortgage arrears.
  3. The services Other basic assistance, Advice/information and Advocacy/liaison on behalf of client  have not been included in the top 10 shown above.

Source: AIHW analysis of SHS longitudinal data 2015–22, Table PHL1920.4.

How the persistent homelessness cohort compares with a non-persistent homelessness cohort

There were almost 102,400 non-persistent homelessness clients in 2019–20 (that is, SHS clients who received support at any time during 2019–20 and had at least one month of homelessness from July 2019 to June 2020, and who were not homeless for more than 7 months out of 24 months, counting from the last supported month in 2019–20). Compared with these clients, during the defining period, the 2019–20 persistent homelessness cohort clients were (Figure Persistent.2; Table PHL1920.1):

  • More likely to have 3 or more support periods (55% of the persistent homeless cohort compared with 32% of the non-persistent homeless group)
  • Twice as likely to have received SHS services in the retrospective period (50% compared to 26% of non-persistent homelessness cohort), and more likely to have continued receiving SHS support into prospective period (43% compared with 35%)
  • More likely to receive accommodation (of any type) (74% compared with 47%), especially medium-term accommodation (37% compared with 7.3%)
  • More than twice as likely to have ended support period in public or community housing after having started that support period in a different housing situation (24% compared with 10%)
  • More likely to have started a period of support in public or community housing and ending that period of support in a different housing situation (17% compared with 11%).

How did service needs differ?

Differences in identified service need between persistent homelessness and non-persistent homelessness clients receiving SHS support were examined using relative risk, which was calculated by dividing the risk of an event occurring for one group (specifically, service need for each service type separately for clients experiencing persistent homelessness) by the risk of an event occurring for another group (service need for non-persistent homelessness clients).

During the defining study period, clients experiencing persistent homelessness were around 4 times more likely to need assistance for physical disability services (relative risk 3.98) and 3 times more likely to need assistance for intellectual disability services (RR 3.44), counselling for problem gambling (RR 3.28), psychiatric services (RR 3.21) and training assistance (RR 3.11) (Figure Persistent.6; Table PHL1920.5).

Of the defining cohort clients who receive services in the past, clients experiencing persistent homelessness were 4 times more likely to need assistance with immigration services (RR 4.07) and 3 times more likely to need assistance for interpreter services (RR 3.21) and physical disability services (RR 3.02).

Figure Persistent.6: Relative risk of needing a SHS service type, PHL and non-PHL clients, by study period, 2019–20

The interactive risk ratio plot shows the differences in service need between PHL and non-PHL clients receiving SHS support in each study period, these associations are presented as relative risks. The top 6 services more likely to be needed by PHL cohort clients compared with non- PHL clients (that is, those with the largest relative risk) have been shown in the figure. A radio button allows selection of the services and relative risks for each of the study periods (defining, retrospective and prospective). PHL clients were 4 times more likely to need physical disability services (relative risk [RR] 3.98) and 3 times more likely to need Intellectual disability services (relative risk [RR] 3.44) during the 2019–20 defining study period than clients in the non-PHL cohort.

Visualisation not available for printing

Note: Relative risk is derived by comparing two groups for their likelihood (risk) of an event. It is calculated by dividing the probability of a cohort client needing a SHS service/assistance divided by the probability of a non-cohort client needing a SHS service/assistance.

Source: AIHW analysis of SHS longitudinal data 2015–22, Table PHL1920.5.

Factors associated with SHS support

Descriptive regression models were used to examine whether client characteristics or support experience in the defining period were associated with SHS support in the prospective study period (ongoing service use). Information on interpreting regression models can be found in the section Understanding factors associated with past and future support. Two models were created; a ‘client characteristic’ model (Model 1) that contained client characteristics and a ‘reasons’ model (Model 2) that supplemented these characteristics with flags for the 26 possible reasons why the client sought support during the defining study period. Multiple regression is used, which in this case means that the effect of each variable is measured while keeping the effects of all other variables in the model constant.

Variations in state and territory specific policies and service delivery models mean that the likelihood of a client receiving services in the future varies among states and territories. Therefore, in addition to a national model, separate regression models were created for each state or territory where there was sufficient sample size (at least 3,500 clients; Table PHL1920.1). The models are descriptive, that is, they are intended to describe the client variables that are associated with past or future service use without proposing or testing specific causal pathways.

The outcome variable (receipt of SHS support) was a binary measure (yes or no) and did not distinguish between clients that needed SHS services only once in the prospective study period and clients that required frequent support.

Risk ratios were created to measure the association between the use of SHS services and a set of client characteristics (see Glossary entry on Relative Risk for how to interpret the results)

Some bias is present in this outcome measure because some clients who required services in the future may not have been able to receive them (see the section on Bias within the SHSC longitudinal data).

The results from the client characteristic model (Model 1) (Figure Persistent.7, Table PHL1920.6) indicate that the largest association with receiving services in the prospective period was having been unemployed or not in the labour force in the defining period (50% more likely). Other associations included rough sleeping (1.28 times more likely), having problematic drug or alcohol issues (1.23 times more likely) and having started a support period in public or community housing and ended that period of support in a different housing situation (1.21). Indigenous Australians were 1.19 times more likely than non-Indigenous Australians to receive future SHS support.

The results from the reasons model (Model 2) shows similar associations. In addition, clients that had been itinerant or had FDV as a reason for seeking support had a greater likelihood of using SHS services in the prospective period (1.16 and 1.15 times higher, respectively).

In contrast, having ended support period in public or community housing after starting that support period in a different housing situation was shown in both models to be associated with decreased likelihood of using SHS services in the prospective period (25% less likely).

Figure Persistent.7: Persistent homelessness cohort past and future service use

The interactive risk ratio plot shows the characteristics or reasons for presenting that are associated with the PHL cohort clients’ use of SHS services in the past (retrospective) or future (prospective period), these associations are presented as relative risks. Relative risks for all states and territories and Australia can be selected and displayed. Two regression models can be selected, Model 1 contains client characteristics and experiences in the defining period, Model 2 contains client characteristics and the reasons for seeking support in the defining study period. For both past and future SHS support the associations were similar. Nationally, being not employed or having started support in public or community housing and ended elsewhere at some time during the defining study period or selecting Itinerant as reasons for seeking support had the strongest association with past or future SHS support.

Visualisation not available for printing

Notes:

  1. Apart from overseas-born  and Indigenous, all other parameters capture whether a client ever experienced that situation in the defining period (for example, homeless  captures whether the client was homeless at any time during a support period in the defining study period).
  2. Not employed  means unemployed or not in the labour force.
  3. Presented with child(ren)  means that the client started at least one support period in the defining study period with one or more children.
  4. Model 1 contains client characteristics and experiences in the defining period, Model 2 contains client characteristics and also the reasons for seeking support in the defining study period.

Source: AIHW analysis of SHS longitudinal data 2015–22, Table PHL1920.6.

Summary

There were nearly 26,900 clients in the 2019–20 persistent homelessness cohort. Half had used services in the past and over 43% continued to use services into the future. Over a quarter (27%) of clients experiencing persistent homelessness were long-term clients.

These clients had similar age and sex profiles to other clients experiencing homelessness who were not experiencing persistent homelessness. However the persistent homelessness cohort were much more likely to receive accommodation (of any type) (74% compared with 47% for the non-persistent group), especially medium-term accommodation.

When compared to non-PHL cohort, clients experienced persistent homelessness in 2019–20 were more likely to need services such as physical disability services, intellectual disability services, counselling for problem gambling, psychiatric services and training assistance.

Data tables

References

AIHW (Australian Institute of Health and Welfare) (2022). National Housing and Homelessness Agreement Indicators

OECD (Organisation for Economic Co-operation and Development) (2020). Better data and policies to fight homelessness in the OECD, Policy Brief on Affordable Housing, OECD, Paris.