< explore study cohort ARTICLES


Study cohort – Specialist homelessness services: Clients returning to homelessness in 2019–20

Introduction

A large majority of the homeless population in most countries are homeless for only a short period of time before finding a more stable housing solution, however, a smaller share of the homeless population experiences longer or multiple episodes of homelessness (OECD 2020).

Clients of Specialist Homelessness Services (SHS) returning to homelessness (RHL), specifically, people who were experiencing homelessness, who achieved housing and then returned to homelessness are categorised under the broader term, repeat homelessness. More contextual information about this cohort can be found in the Overview of SHS client groups – see the Repeat homelessness group.

SHS clients returning to homelessness has decreased over time, from 16,900 clients in 2018–19 to 16,100 clients in 2021–22 (AIHW 2022).

In 2021–22, overnight accommodation was provided to almost 83,200 SHS clients and over 9,300 of these clients (11%) were those who had returned homelessness (not all clients with a returning to homelessness housing pattern received overnight accommodation). Of the total 7.8 million nights of accommodation provided in 2021–22, 0.9 million nights (12%) were provided to clients returning to homelessness.

It is important to note that these results are restricted to people who received support from an SHS agency and their housing situation was only assessed when they were receiving support. The data does not describe all people who might experience returning to homelessness housing pattern, nor the housing situation of SHS clients when they were not receiving SHS support. 

Longitudinal analyses have been undertaken for a 2019–20 return to homelessness cohort. This cohort was defined as clients who received SHS support at any time during 2019–20, and who:

  • had at least 1 month of homelessness during July 2019 to June 2020, and
  • experienced a homeless–housed–homeless pattern in any time during the 24-months period prior to the last month experiencing homelessness in 2019–20.

The number clients returning to homelessness in the client pathways study cohort (16,000) is less than the number of clients returning to homelessness reported using annual data (16,300) (AIHW 2022) because the pathway analyses used more stringent quality requirements for the analysis of clients. Therefore, some clients with less accurate information were excluded from the pathways analyses.

See Introduction to the SHS longitudinal data for details on the longitudinal analyses undertaken.

A comparison cohort (non-return to homelessness) was created, comprising clients who received SHS support at any time during 2019–20, and who:

  • had at least 1 month of homelessness during July 2019 to June 2020, and
  • had not experienced a homeless–housed–homeless pattern in any time during the 24-months period prior to the last homeless month in 2019–20.

More information on the how comparison cohorts were derived can be found in the Methodology section.

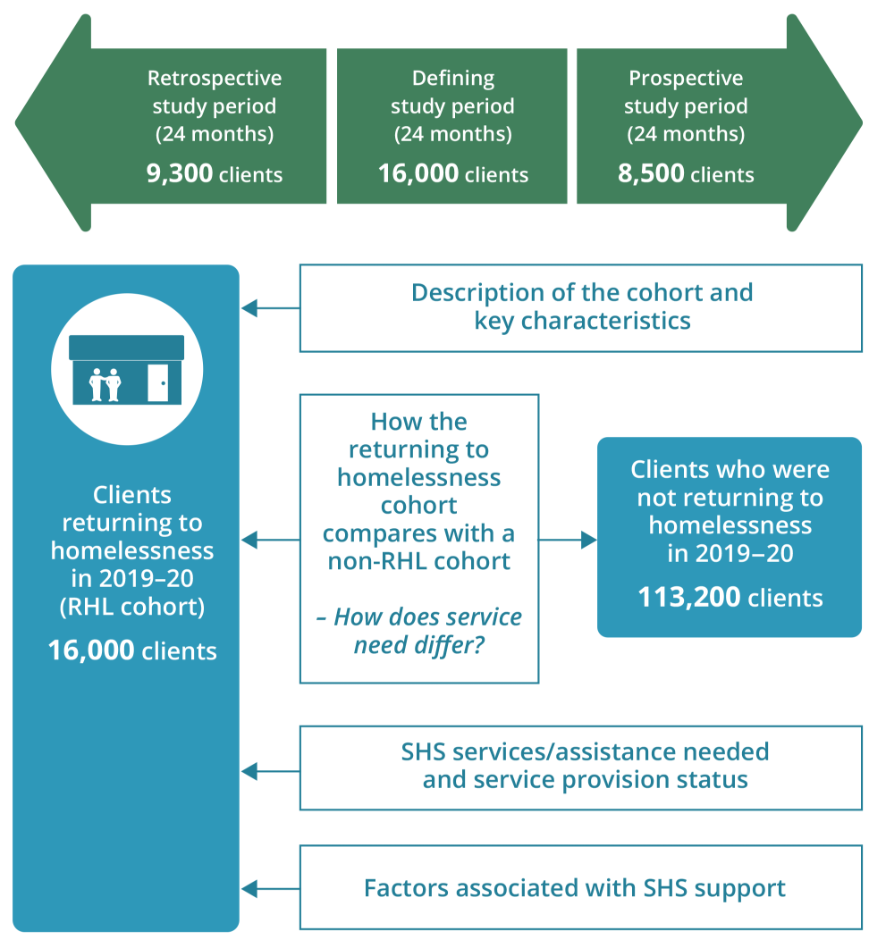
The longitudinal SHS data for the period 2015–22 were used to examine characteristics and service use patterns of the 2019–20 return to homelessness cohort compared with the 2019–20 non-return to homelessness cohort (Figure Return.1).

The defining study period for these cohorts is the 24 months prior to the last support for each client between July 2019 and June 2020. The retrospective study period is the 24 months before the start of each client’s 24 month defining study period, and the prospective study period is the 24 months after the end of each client’s 24 month defining study period.

Key findings

  • 60% of clients returning to homelessness in 2019–20 were female.
  • The majority (78%) of the return to homelessness cohort had 3 or more support periods during the defining study period.
  • Around 3 out of 5 returning to homelessness clients in 2019–20 had a current mental health issue or had experienced FDV; a third had problematic drug/alcohol uses.
  • The proportion of clients who received any accommodation (of any type) was greater for clients returning to homelessness (73% compared with 50% for non-returning to homelessness clients).

Figure Return.1: Clients retuning to homelessness cohort, longitudinal analysis overview

The infographic shows how the longitudinal analysis for the 2019–20 RHL cohort are structured and how the cohort and study periods are defined. The 2019–20 RHL cohort was defined as clients who received SHS support at any time during 2019–20, and who had at least 1 month of homelessness during July 2019 to June 2020, and experienced a homeless–housed–homeless pattern in any time during the 24-months period prior to the last month experiencing homelessness in 2019–20. For this analysis, the defining study period for these cohorts is the 24 months prior to the last support for each client between July 2019 and June 2020. The retrospective study period is the 24 months before the start of each client’s 24 month defining study period, and the prospective study period is the 24 months after the end of each client’s 24 month defining study period. The analysis for these cohort clients included, a description of the cohort and key characteristics/vulnerabilities, SHS services/assistance needed and service provision status for RHL cohort clients, a comparison between the RHL and non-RHL cohort, RHL cohort client characteristics associated with SHS support in the past and future.

Key characteristics of the return to homelessness 2019–20 cohort

There were nearly 16,000 clients of SHS agencies who returned to homelessness during 2019–20 with the following characteristics during the defining study period (Figure Return.2, Table RHL1920.1, Table RHL1920.2):

  • Three out of 5 clients (60% or 9,600) were female.
  • About 2 out of 5 clients (38% or 6,100) were Indigenous.
  • Almost 2,000 clients (12%) were born overseas.
  • Almost 4 out of 5 client (78% or 12,500 clients) had 3 or more support periods during the defining study period, 14% (2,300 clients) had 2 support periods.
  • Over three quarters (78% or 12,500 clients) needed long-term accommodation in the defining period, and 3.8% of those (600 clients) received that type of accommodation.
  • Over a quarter (27%) had started their support period in public or community housing and ended that period of support in a different housing situation.
  • Around 42% (6,800 clients) presented for support with children sometime in the defining study period; around 83% (13,300 clients) presented for support alone at some time.

Figure Return.2: Return to homelessness cohort 2019–20, client key characteristics, by study period

This interactive bar chart shows a comparison between the RHL and non-RHL cohorts, in terms of key characteristics and across all study periods (defining, retrospective and prospective). A radio button allows selection for the individual state/territory and Australia. For Australia, RHL clients were more likely to be female (RHL clients 60% compared with 53% non-RHL clients) and more likely to have problematic drug or alcohol issues (33% compared with 16%) and mental health issues (64% compared with 40%). They were less likely to have one support period (8% compared with 46%) and more likely to have three or more support period (78% compared with 31%). RHL clients were also more likely to receive accommodation (of any type) (74% compared with 50%).

Visualisation not available for printing

Notes

  1. Counts of clients with values of No include cases where the variable is not stated or unknown.
  2. Clients are counted as Indigenous or overseas-born if they are classified as such in any support period in the longitudinal data.
  3. Percentages are calculated using total clients within the cohort as the denominator (Returning cohort: 16,023, non-returning cohort: 113,247). For the retrospective and prospective study periods the percentages may not add to 100 as not all cohort clients are included in these periods.
  4. Received accommodation indicates that the client was provided either short-term or emergency accommodation, medium term/transitional housing, or long-term housing.
  5. Short-term clients received SHS services only during the defining study period. Historical clients received SHS services in the retrospective and defining study periods. Ongoing clients received SHS services in the defining and prospective study periods. Long-term clients, received SHS services in all three study periods.
  6. Reason refers to the reasons a client presented to any specialist homelessness services agency during the study period.
  7. The variable Ever Presented Alone refers to whether a client was ever recorded as having presented for support (that is, started a support period) alone. Unlike many other variables, this is only recorded in the SHS data at the start of support periods. Counts of clients with values of No include cases where the variable is not stated or unknown. Note: for children, there may be instances where the child physically presented with an adult to an agency, but only the child required and received SHSC services, or where the child was not correctly linked to the group when the support period was opened.
  8. The variable Presented with child(ren) indicates whether the client presented for support (that is, started a support period) as part of a group which contained one or more children.

Source: AIHW analysis of SHS longitudinal data 2015–22, Table RHL1920.1.

Service engagement profiles

Service use patterns of the return to homelessness cohort 2019–20 over the longitudinal period (2015–22) were examined (Figure Return.3, Table RHL1920.1, Table RHL1920.2).

Short-term clients received SHS services only during the defining study period.

Historical clients received SHS services in the retrospective and defining study periods.

Ongoing clients received SHS services in the defining and prospective study periods.

Long-term clients received SHS services in all three study periods.

Of the 16,000 clients with a return to homelessness housing pattern in 2019–20:

  • Over a third (35% or 5,600 clients) were long-term clients, receiving support in all three study periods.
  • Around a quarter (24% or 3,900 clients) were short-term clients receiving services only during the 24-month defining study period.
  • Under a quarter (23% or 3,600 clients) were historical clients who were supported in the retrospective and defining periods, and 18% (2,900 clients) were ongoing clients who were supported in the defining and prospective periods.

Figure Return.3: Return to homelessness cohort 2019–20, service engagement profiles

This interactive bar chart shows service use patterns of the 2019–20 RHL cohort over the 2015–22 longitudinal period. Support information was combined from the discrete study periods into four service engagement profile groups (historical, short-term, long-term and ongoing). Engagement profiles for all states and territories and Australia can be selected and displayed. Nationally, of the 16,100 clients that made up the defining period cohort, 3,900 (24%) were short-term clients who only received support during the 24-month defining study period and 5,600 (35%) were long-term clients and had received support in all three study periods.

Note: Short-term clients received SHS services only during the defining study period.  Historical clients received SHS services in the retrospective and defining study periods. Ongoing clients received SHS services in the defining and prospective study periods. Long-term clients received SHS services in all three study periods.

Source: AIHW analysis of SHS longitudinal data 2015–22, Table RHL1920.1.

Vulnerability pathways

Using data for the 2015–22 period, client profiles were examined for the presence of vulnerabilities including a current mental health issue, drug and/or alcohol problems, and experience of family and domestic violence (FDV) within each of the 3 study periods – the retrospective, defining and prospective periods (Figure Return.4, Table RHL1516.1, Table RHL1516.3). For more information on the derivation of these vulnerabilities, see Methodology.

During the defining study period, 10,300 return to homelessness clients had mental health issues, 9,400 clients had experienced family and domestic violence and 5,300 clients had problematic drug/alcohol issues.

  • Of the 10,300 clients who had mental issues during the defining period, around 41% of these clients had mental health issues and received SHS support during the retrospective period, 39% had mental health issues and received SHS support in the following 24-month prospective period.
  • Of the 9,400 clients returning to homelessness who experienced FDV during the study period, 39% of these clients experienced FDV and received SHS support during the retrospective, 35% experienced FDV and received SHS support during the prospective periods.
  • Of the 5,300 clients who had problematic drug/alcohol use during the study period, 32% of these clients had problematic drug/alcohol issues and received SHS support during the retrospective, 28% had problematic drug/alcohol issues and received SHS support during the prospective periods.

Figure Return.4: Return to homelessness cohort 2019–20, vulnerability pathways

The interactive stacked horizontal bar graph shows the select top 10 services needed and the provision/referral status for the 2019–20 RHL cohort clients (16,100 clients) who received support in the retrospective, defining and prospective study periods. Across all study periods, short-term or emergency accommodation was one of the most needed services, around 84% of these clients were either provided this service or referred to another agency. Material aid/brokerage was also a key service needed by this cohort; this service was provided/referred to over 96% of clients.

Notes

  1. Percentages are calculated using total clients who experienced the selected vulnerability in the defining period as the denominator (Family and domestic violence: 9,384, Mental health issues: 10,311, Problematic drug/alcohol use: 5,325).
  2. The defining study period covered 24 months prior to the last day of their last support period during 2019–20. The prospective period for this cohort was 24 months (that is, the 24 months after the last day of the client’s last support period in 2019–20). The retrospective study period for each client ranged for the 24 months before the defining period started.

Source: AIHW analysis of SHS longitudinal data 2015–22, Table RHL1920.3.

SHS services needed by clients returning to homelessness

Service need and service provision/referral was examined for clients returning to homelessness in 2019–20. Aggregation of service is based on services needed or provided/referred in support periods that commenced within each study period only. It is important to note that all clients in the 2019–20 returning to homelessness cohort experienced return to homelessness housing pattern during the defining period, however, not all of them experienced the same housing pattern in the retrospective or prospective periods. That is, they may have had other housing patterns and therefore different service needs in the retrospective and prospective periods.

Patterns of service use among clients returning to homelessness in 2019–20 were generally similar across the 3 study periods, with housing services and financial-related service the most needed services. Other services that were also commonly needed included financial information, transport, living skills/personal development, assistance for family/domestic violence and meals (Figure Return.5; Table RHL1920.1, Table RHL1920.4).

Figure Return.5: Clients returning to homelessness in 2019–20, select top 10 services and assistance needed and service provision status by study period

This interactive Sankey diagram shows the 2019–20 RHL cohort clients who experienced three vulnerabilities, clients who had experienced FDV, clients with a mental health issue and those with problems with drugs or alcohol in the defining study period and whether clients also experienced these vulnerabilities in the past and future study periods. These vulnerability pathways are shown separately, using radio buttons to select between vulnerability types. Using data for the entire longitudinal period, SHS RHL cohort clients were assessed for the presence of these vulnerabilities within each of the three study periods – the retrospective, defining and prospective periods. Vulnerability data and pathways for all states and territories and Australia can be selected and displayed. Most clients at the national level only experienced the vulnerability in the defining study period and were not SHS clients in the retrospective and prospective study periods.

Notes

  1. Percentages are based on the number of clients who needed the service in each study period as the denominator.
  2. Any accommodation assistance  refers to need or provision of any of short-term or emergency accommodation, medium term/transitional housing, long-term housing, assistance to sustain tenancy or prevent tenancy failure or eviction, assistance to prevent foreclosures or for mortgage arrears.
  3. The services Other basic assistance, Advice/information and Advocacy/liaison on behalf of client  have not been included in the top 10 shown above.

Source: AIHW analysis of SHS longitudinal data 2015–22, Table RHL1920.4.

How the return to homelessness cohort compares with a non-return to homelessness cohort

There were over 113,200 clients in the non-return to homelessness cohort in 2019–20. That is, SHS clients who received support at any time during 2019–20 and had at least one month of homelessness during July 2019 to June 2020, and had not experienced a homeless–housed–homeless pattern in any time during the 24-month period prior to the last homeless month in 2019–20.

Compared to clients not returning to homelessness, during the defining study period, the 2019–20 return to homelessness cohort were (Figure Return.2; Table RHL1920.1):

  • more likely to be female (60% of the returning to homelessness cohort compared with 52% of the non-returning group).
  • more likely to had exited an institution (12% compared with 5.2%) and transitioned from custody (9.0% compared with 5.9%).
  • more likely to continue receiving support into prospective period (53% compared with 35%) and more than twice as likely to have received services in the retrospective period (58% compared with 27%).
  • more than twice as likely to be long-term clients (35% compared with 14%) and less likely to be short-term clients (24% compared with 52%).
  • more likely to have had mental health issues (64% compared to 40%), more likely to have experienced FDV (59% compared with 40%) and more than twice as likely to have problematic drug/alcohol uses (33% compared with 16%).
  • more likely to have received accommodation (of any type) (73% compared with 50%), with 65% having received short-term accommodation, 21% received medium-term accommodation and 3.8% received long-term accommodation.
  • more than twice as likely to have ended a support period in public or community housing after having started that support in a different housing situation (25% compared with 11%). These clients were also almost three times as likely to have started in public housing but ended support elsewhere (27% compared with 10%).

How did service needs differ?

Differences in identified service need between return to homelessness and non-return to homelessness clients receiving SHS support were examined using relative risk, which was calculated by dividing the risk of an event occurring for 1 group (specifically, service need for each service type separately for clients returning to homelessness) by the risk of an event occurring for another group (service need for non-return to homelessness clients).

In the defining period, the returning to homelessness clients were approximately 3 times more likely to need assistance for pregnancy services, assistance for incest/sexual assault and counselling for problem gambling compared to the comparison cohort (relative risk 3.08, and 2.66 respectively). Return to homelessness clients were also 2 times more likely than the non-returning cohort to need these services during the retrospective and prospective periods.

Other distinctive services needed includes family planning support and psychiatric services. Clients returning to homelessness were approximately twice as likely to need these services during all three periods.

Figure Return.6: Relative risk of needing a SHS service type, return to homelessness and non-return to homelessness clients, by study period, 2019–20

The interactive risk ratio plot shows the differences in service need between RHL and non-RHL clients receiving SHS support in each study period, these associations are presented as relative risks. The top 6 services more likely to be needed by RHL cohort clients compared with non- RHL clients (that is, those with the largest relative risk) have been shown in the figure. A radio button allows selection of the services and relative risks for each of the study periods (defining, retrospective and prospective). RHL clients were 3 times more likely to need pregnancy assistance (relative risk [RR] 3.08) and assistance for incest/sexual assault (relative risk [RR] 2.71) during the 2019–20 defining study period than clients in the non-RHL cohort.

Note: Relative risk is derived by comparing two groups for their likelihood (risk) of an event. It is calculated by dividing the probability of a cohort client needing a SHS service/assistance divided by the probability of a non-cohort client needing a SHS service/assistance.

Source: AIHW analysis of SHS longitudinal data 2015–22, Table RHL1920.5.

Factors associated with SHS support

Descriptive regression models were used to examine whether client characteristics or support experiences in the defining period were associated with SHS support in the retrospective study period (past SHS support) or prospective study period (ongoing service use). Information on interpreting regression models can be found in the section Understanding factors associated with past and future support. Two models were created; a ‘client characteristic’ model (Model 1) that contained client characteristics and a ‘reasons’ model (Model 2) that supplemented these characteristics with flags for the 26 possible reasons why the client sought support during the defining study period. Multiple regression is used, which in this case means that the effect of each variable is measured while keeping the effects of all other variables in the model constant.

Variations in state and territory specific policies and service delivery models mean that the likelihood of a client receiving services in the future varies among states and territories. Therefore, in addition to a national model, separate regression models were created for each state or territory where there was sufficient sample size (at least 3,500 clients; Table RHL1920.1). The models are descriptive, that is, they are intended to describe the client variables that are associated with past or future service use without proposing or testing specific causal pathways.

The outcome variable (receipt of SHS support) was a binary measure (yes or no) and did not distinguish between clients that needed SHS services only once in the prospective study period and clients that required frequent support.

Risk ratios were created to measure the association between the use of SHS services and a set of client characteristics (see Glossary entry on Relative risk for how to interpret the results)

Some bias is present in this outcome measure because some clients who required services in the future may not have been able to receive them (see the section on Bias within the SHSC longitudinal data).

The results from the client characteristic model (Model 1) (Figure Return.7, Table RHL1920.6) indicate that the largest association with receiving services in the prospective period was being unemployed or not in the labour force during support (1.38 times more likely). Other significant associations include rough sleeping (1.23 times more likely), having started a support period in public or community housing and ended that period of support in a different housing situation (1.19). Being Indigenous also has a high association with future SHS support (1.16 times more likely than non-Indigenous Australians).

The results from the reasons model (Model 2) shows similar associations such as lack of employment, being Indigenous, having started a support period in public or community housing and ended that period of support in a different housing situation and rough sleeping. In addition, clients that had itinerant or financial difficulties as a reason for seeking assistance had a greater likelihood of needing SHS support in the prospective period (1.13 and 1.12 times, respectively).

In contrast, having ended support period in public or community housing after starting that support period in a different housing situation was shown in both models to be associated with a decreased likelihood of needing SHS support in the prospective period (13% less likely).

Figure Return.7: Return to homelessness cohort past and future service use

The interactive risk ratio plot shows the characteristics or reasons for presenting that are associated with the RHL cohort clients’ use of SHS services in the past (retrospective) or future (prospective period), these associations are presented as relative risks. Relative risks for all states and territories and Australia can be selected and displayed. Two regression models can be selected, Model 1 contains client characteristics and experiences in the defining period, Model 2 contains client characteristics and the reasons for seeking support in the defining study period. For both past and future SHS support the associations were similar. Nationally, being not employed or having started support in public or community housing and ended elsewhere at some time during the defining study period or selecting Itinerant as reasons for seeking support had the strongest association with past or future SHS support.

Notes

  1. Apart from overseas-born  and Indigenous, all other parameters capture whether a client ever experienced that situation in the defining period (for example, homeless  captures whether the client was homeless at any time during a support period in the defining study period).
  2. Not employed  means unemployed or not in the labour force.
  3. Presented with child(ren)  means that the client started at least one support period in the defining study period with one or more children.
  4. Model 1 contains client characteristics and experiences in the defining period, Model 2 contains client characteristics and also the reasons for seeking support in the defining study period.

Source: AIHW analysis of SHS longitudinal data 2015–22, Table RHL1920.6.

Summary

There were over 16,000 clients in the 2019–20 return to homelessness cohort. Almost 3 out of 5 clients had used services in the past and more than half continued to use services into the future. Over a third of clients returning to homelessness were long-term clients.

SHS clients experiencing a return to homelessness were three times more likely than the non-return to homelessness cohort to need pregnancy services, assistance for incest/sexual assault and counselling for problem gambling during the defining period, and two times more likely during retrospective and prospective periods.

Compared to non-RHL cohort, clients returning to homelessness were more likely to have had mental health issues, more likely to have experienced FDV and more than twice as likely to have problematic drug/alcohol uses.

Data Tables

References

AIHW (Australian Institute of Health and Welfare) (2022). National Housing and Homelessness Agreement Indicators.

OECD (Organisation for Economic Co-operation and Development) (2020). Better data and policies to fight homelessness in the OECD, Policy Brief on Affordable Housing, OECD, Paris.