Policy framework for reducing homelessness and service response
Governments across Australia fund a range of services to support people who are homeless or at risk of homelessness. These services are delivered by non-government organisations including agencies specialising in delivering services to specific target groups (such as young people or people experiencing domestic violence), as well as those that provide more generic services to those facing housing crises.
This report describes:
- the people who received assistance from specialist homelessness agencies in 2015‒16, the assistance they received and their changes in housing and other circumstances
- trends in the characteristics of clients, the services they receive, and their outcomes
- the people who requested services in 2015‒16 but were not provided with support at that time.
Data describing clients who have a disability and need support with core activities are presented from 2013‒14 onwards.
The data in this publication are compiled from the Specialist Homelessness Services Collection (SHSC), which is conducted by the Australian Institute of Health and Welfare (AIHW).
People who are homeless or facing homelessness may also access a range of mainstream services that are available to the broader community (such as income support payments or health services). These services are not described in this report.
Policy framework for reducing homelessness
Many Australians experience events in their life that may place them at risk of homelessness. It is estimated that half (50%) of lower income households experience affordability issues due to rental stress (paying more than 30% of their gross income on housing costs) [1], and around 1 in 6 women have experienced some form of domestic and family violence in their lifetime, putting them at risk of homelessness [2].
In the 2011 Census, 105,000 Australians were classified as homeless. This figure includes people in supported accommodation for the homeless, people in temporary accommodation, those 'sleeping rough' and people living in severely crowded dwellings (those that required 4 or more extra bedrooms to accommodate the residents) [3].
Responses to homelessness are funded under the National Affordable Housing Agreement (NAHA). The NAHA is supported by the National Partnership Agreement on Homelessness (NPAH). The NPAH contributes to the NAHA outcome that 'people who are homeless or at risk of homelessness achieve sustainable housing and social inclusion' and outlines the roles and responsibilities of the Australian Government and state and territory governments in relation to reducing and preventing homelessness. In 2015‒16, the Australian government committed funding of $230 million over 2 years, under the NPAH, which was matched by states and territories to fund the delivery of specialist homelessness services.
About the Specialist Homelessness Services Collection
The SHSC began on 1 July 2011. The collection has been designed to collect data from homelessness agencies that are funded under the NAHA and the NPAH. State and territory departments identify agencies that are expected to participate in data collection. These agencies vary widely in terms of the services they provide and the service delivery frameworks they use. These frameworks may be determined by the state or territory funding department or developed as a response to local homelessness issues (see What are specialist homelessness agencies for more details).
All SHSC agencies report standardised data about the clients they support each month to the AIHW, as specified in the Specialist Homelessness Services National Minimum Dataset (NMDS). Data are collected about the characteristics and circumstances of clients when they first present at an agency. Further data―on assistance received and circumstances―are collected at the end of every month in which the client receives services and again when contact with the client has ceased. Some data are self-reported, others require consent to publish. Information regarding these items is found in the Technical information section.
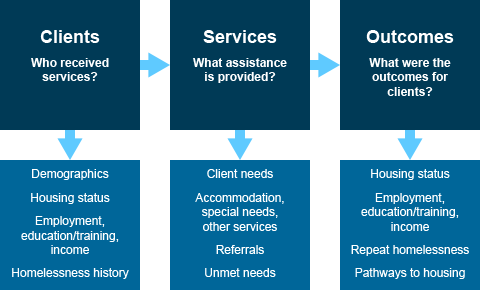
This information contributes to building a picture of clients, the specialist homelessness services that were provided to them and outcomes achieved for the client (Figure FRAMEWORK.1). SHSC data provide a measure of the service response directed to those who are experiencing housing difficulty. The data do not provide a measure of the extent of homelessness in the community, although SHSC data on emergency and supported accommodation do contribute to the profile of homelessness in Australia.
Figure framework 1: Conceptual framework of the SHSC client collection
The data collected by agencies are based on periods of support provided to clients. These support periods vary in terms of their duration, the number of contacts between Specialist Homelessness Services (SHS) workers and clients, and the reasons support ends. Some support periods are relatively short (and are likely to have begun and ended in 2015‒16) and others are much longer―many of these might have been ongoing from the previous year, and/or were still ongoing at the end of 2015‒16.
Certain information collected about the client (selected letters of name, date of birth and sex) is used to construct a Statistical Linkage Key (SLK) to bring together all data about each client who had multiple support periods (either with the same agency or with different agencies) during the reporting year. Note that while a client may have received SHS support in a previous year, use of homelessness services in prior year(s) is out of scope for SHS annual reporting purposes.
All data presented in this report and in the supplementary tables have been adjusted for agency non-response and data error in the Statistical Linkage Key (SLK). Detailed information about the weighting and estimation strategy for 2015‒16 can be found in the Technical information section.
Data tables from which these analyses are drawn are provided as supplementary tables to this report. All percentages given are based on valid responses reported for clients, and the extent of missing data is indicated in the supplementary tables.
Further information about the collection, imputation methodology applied to these data, and information about the quality of the data obtained through the SHSC for 2015‒16 is available in the Technical information section.
Delivery of homelessness services across Australia
Each state and territory manages their own system for the assessment, intake, referral and ongoing case management of specialist homelessness services clients. Box FRAMEWORK.1 summarises the delivery systems operating in Australia. Although presented as 3 distinct delivery models, these systems are representative of a range of approaches jurisdictions may employ to coordinate entry into specialist homelessness services. Changes implemented by jurisdictions in the delivery of services and their associated responses have the potential to impact SHSC annual data.
Box FRAMEWORK.1
Community sector funding and support:
- Assessment & intake: managed by individual SHS providers, consistent with state or territory policies.
- Referral: refer to other SHS providers if clients' needs are not able to be met by initial SHS provider.
- May be supported by a coordinating service.
Central information management:
- Assessment, intake and referral: managed at any SHS provider, via state or territory central information management tool.
- Central information management system assists in the identification of appropriate services and indicates the availability/vacancy of services at all SHS providers.
Central intake:
- Assessment, intake and referral: managed by one or more 'central intake' agency.
- Central intake agencies prioritise access to services and only refer clients as services and/or vacancies are available.
- Central information management tool may exist to share information between SHS providers.
What are specialist homelessness agencies?
A specialist homelessness agency reporting to the SHSC is an organisation that receives government funding to deliver accommodation-related and personal services to people who are homeless or at imminent risk of homelessness. While it is recognised that other organisations not directly funded by the Commonwealth government also provide a wide range of services to this sector, these organisations are not required to provide data to the SHSC.
SHS agencies vary considerably in size and in the types of assistance they provide. Across Australia, agencies provide services aimed at prevention and early intervention, crisis and post crisis assistance to support people experiencing or at risk of homelessness. For example, some agencies focus specifically on assisting people experiencing homelessness, while others deliver a broader range of services, including youth intervention services, domestic and family violence services and housing support services to those at risk of becoming homeless. The service types an agency delivers range from basic, short-term interventions such as advice and information, meals, and shower/ laundry facilities through to more specialised, time-intensive services such as financial advice and counselling and professional legal services (see Glossary for a complete list of service types).
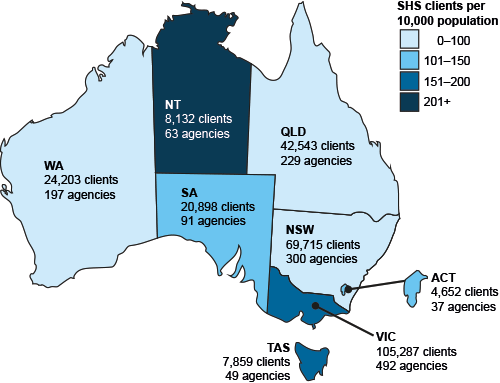
Nationally, there were 1,458 agencies that delivered specialist homelessness services to an estimated 279,196 clients during 2015‒16 (Figure FRAMEWORK.2).
Figure framework 2: Specialist homelessness agencies and clients, by jurisdiction, 2015‒16
Notes
- Client count has been adjusted for non-response. Clients may access services in more than one state or territory, therefore the total will be less than the sum of jurisdictions.
- The agency count includes only those agencies that provided support periods with valid SLKs.
Source: Specialist Homelessness Services, 2015‒16.
Agencies range considerably in size, with some agencies assisting 100 clients per year and others upward of 1,500.Some agencies are represented by a larger 'parent' organisation while others are individual stand-alone agencies. The number of clients agencies assist (agency size), not only reflects the type and complexity of services provided, but also differing state and territory service delivery models. Agency size is also influenced by jurisdictional-specific factors such as the size and geographical distribution of their population. Figure FRAMEWORK.3 illustrates the wide range in agency sizes within each jurisdiction. Across all jurisdictions in 2015‒16 the largest proportion of agencies assisted fewer than 100 clients, ranging from 61% in Western Australia to 29% in South Australia. Agencies assisting a large number of clients (more than 1,500 in 2015‒16) exist in all jurisdictions except the Northern Territory. Victoria has the most agencies of this size (22).
Figure framework 3: Specialist homelessness agencies, by client range and jurisdiction, 2015‒16
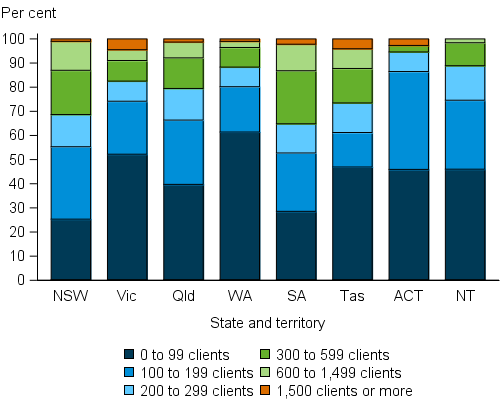
Note: Client count has been adjusted for non-response.
Source: Specialist Homelessness Services 2015‒16.
SHS agencies and their service delivery
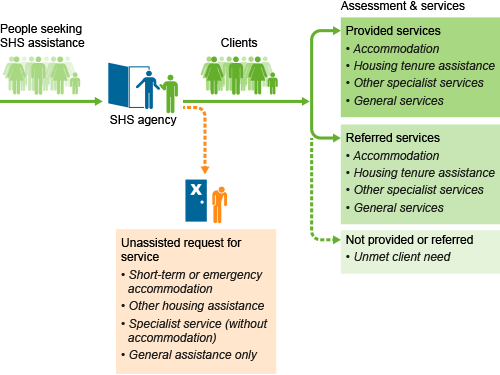
Specialist homelessness services can either be provided to the client by the agency, or a client may be referred to another agency for a specific service (Figure FRAMEWORK.4). In some instances, a client may neither receive nor be referred for a service and their need therefore goes unmet (see Unmet demand for specialist homelessness services section). These unmet needs are captured to assist in determining the ability of the sector to respond to client needs.
Sometimes SHS agencies cannot assist people who are homeless or at risk of homelessness. These instances are captured to assist in determining the ability of the sector to cope with demand. An 'unassisted request for service' is an instance where a person who approaches an agency is unable to be provided with any assistance (see Technical information section).
Figure framework 4: Access to and delivery of specialist homelessness services
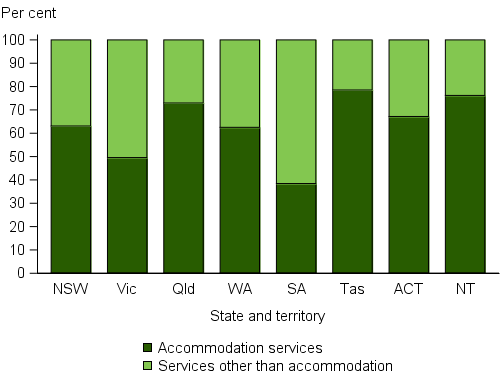
Specialist homelessness services in all jurisdictions can be categorised as either accommodation services (either the direct provision of accommodation or assistance for the client to remain housed) or 'services other than accommodation'. The proportion of SHS clients receiving accommodation services varied across states and territories with 76% of clients in Tasmania and the Northern Territory receiving these services (FRAMEWORK.5). In contrast, 61% of clients in South Australia were provided services other than accommodation. This variation reflects differences in the demand for accommodation services, service delivery models, and housing options across jurisdictions.
While the extent to which these data reflect limitations in housing stock cannot be determined, it does serve to highlight governments' commitment to assist not only the homeless into secure housing but also those in unstable housing situations to remain housed. This integration and expansion of specialist homelessness services are reflected in the jurisdictional client profiles in figure framework 5.
Figure framework 5: Clients of specialist homelessness services, by service type, states and territories, 2015‒16
Notes
-
Clients provided or referred accommodation services (short-term or emergency accommodation, medium-term/ transitional housing, long-term housing, assistance to sustain tenancy or prevent tenancy failure or eviction and assistance to prevent foreclosures or for mortgage arrears) are included in the accommodation services category. These clients may have also been provided additional services other than accommodation.
-
The denominator for the proportions is the number of clients who were provided or referred any service during 2015‒16.
-
Clients may access services in more than one state or territory. If they received accommodation services in any jurisdiction they will be counted as having received these services in all jurisdictions in which they received services.
-
The proportion of clients who received accommodation services broadly reflects the demand for accommodation services in each jurisdiction and may be influenced by the delivery model employed in the state or territory and/or a limitation in accommodation stock of the jurisdiction.
Source: Specialist Homelessness Services, 2015‒16.
References
- ABS (Australian Bureau of Statistics) 2013a. Housing and occupancy costs, 2011‒12. ABS cat no. 4130.0. Canberra: ABS.
- ABS 2013b. Personal safety, Australia, 2012. ABS cat no. 4906.0. Canberra: ABS.
- ABS 2012. Census of population and housing: estimating homelessness, 2011. ABS cat no. 2049.0. Canberra: ABS.