Indigenous clients
Aboriginal and Torres Strait Islander people continue to be over-represented in both the national homeless population and as users of specialist homelessness services (see section on Clients, services and outcomes and [1]). Aboriginal and Torres Strait Islander people make up 3% of the Australian population, yet they made up 24% of those accessing specialist homelessness services in 2015–16: an estimated 61,700 clients. Indigenous status was not reported for 10% of SHS clients in 2015–16.
Key findings in 2015–16
- Indigenous client numbers were up 16% from 2014–15 to an estimated 61,700, and grew at a faster rate than the general SHS population (9%). The majority of this growth came from increased client numbers in New South Wales (about 6,600) and Western Australia (over 1,000).
- Nationally, there were more returning Indigenous clients (53%) than new Indigenous clients in 2015–16; that is, over half the Indigenous clients in 2015–16 had received assistance at sometime in the previous 4 years. This is in contrast to non-Indigenous clients where the opposite was observed; 46% of non-Indigenous clients returned in 2015–16 having received homelessness services sometime in the previous 4 years. These trends were observed in the majority of states and territories.
- The frequency of Indigenous client engagement with homelessness agencies increased; average support increased to 1.7 support periods per client, up from 1.6 the previous year.
- The proportion of Indigenous clients receiving accommodation services decreased to 44%, down from 47% in 2014–15 and the median length of accommodation also decreased (19 nights, down from 20).
- In 2015–16 an estimated 2,900 (or 9%) more Indigenous clients ended support in public or community housing and fewer Indigenous clients were in short-term or emergency accommodation following assistance from SHS agencies.
Indigenous clients: trends 2011–12 to 2015–16
Over 157,000
Indigenous clients have been supported by homelessness agencies between 2011–12 and 2015–16.
The number of Indigenous clients has been steadily increasing since the beginning of the SHS collection in 2011–12. The key trends identified over these 5 years have been:
- The rate of service use by Indigenous clients has increased from 587 clients per 10,000 Indigenous people in 2011–12 to 787 per 10,000 in 2015–16 (Table Indigenous Trends.1).
- The gap between Indigenous and non-Indigenous rates of service use continues to widen. In 2015–16 Indigenous people were 9.1 times more likely to use specialist homelessness services than non-Indigenous people, up from 7.8 times in 2011–12.
- After taking into account differences in population size, in 2015–16 Indigenous clients accessed services at the highest rate in Major cities.
- The rate of service use by Indigenous clients living in Remote/Very remote areas has increased by the greatest margin over time; from 499 Indigenous clients per 10,000 population in 2011–12 to 732 in 2015–16. This is in contrast to non-Indigenous clients in the same areas where the rate decreased from 53 clients per 10,000 to 36 clients over the same time period.
- The proportion of Indigenous clients ending support in some form of social or private housing has improved. In 2015–16 around 40% of Indigenous clients assisted ended support in public or community housing compared with 35% in 2012–13.
| 2013–14 Indigenous |
2013–14 Non-Indigenous |
2014–15 Indigenous |
2014–15 Non-Indigenous |
2015–16 Indigenous |
2015–16 Non-Indigenous |
|
|---|---|---|---|---|---|---|
| Number of clients | 49,615 | 167,288 | 53,301 | 173,955 | 61,700 | 190,488 |
| Proportion of all clients where Indigenous status reported | 23 | 77 | 23 | 77 | 24 | 76 |
| Rate (per 10,000 population) | 654.1 | 77.6 | 693.2 | 79.8 | 787.0 | 86.5 |
| Rate ratio | 8.4 | 8.7 | 9.1 | |||
| Rate difference | 576.5 | 613.4 | 700.5 | |||
| Remoteness rate (per 10,000 population) | ||||||
| Major cities | 659.8 | 71.7 | 710.9 | 75.1 | 823.9 | 80.6 |
| Inner/Outer regional | 672.8 | 100.0 | 683.9 | 98.6 | 789.2 | 110.5 |
| Remote/Very remote | 612.7 | 40.0 | 688.5 | 38.2 | 732.4 | 36.4 |
| Rate ratio | ||||||
| Major cities | 9.2 | 9.5 | 10.2 | |||
| Inner/Outer regional | 6.7 | 6.9 | 7.1 | |||
| Remote/Very remote | 15.3 | 18.0 | 20.1 | |||
| Housing situation at the beginning of first support period (proportion of all clients) | ||||||
| Homeless | 46 | 43 | 47 | 43 | 46 | 43 |
| At risk of homelessness | 54 | 57 | 53 | 57 | 54 | 57 |
| Length of support (median number of days) | 41 | 36 | 40 | 35 | 44 | 37 |
| Average number of support periods per client | 1.6 | 1.7 | 1.6 | 1.7 | 1.7 | 1.7 |
| Proportion receiving accommodation | 48 | 34 | 47 | 32 | 44 | 30 |
| Median number of nights accommodated | 22 | 43 | 20 | 42 | 19 | 42 |
| Proportion of a client group with a case management plan | 68 | 59 | 70 | 60 | 70 | 61 |
| Achievement of all case management goals (per cent) | 22 | 23 | 24 | 25 | 21 | 23 |
Notes
- Rates were directly age-standardised as detailed in the Technical information section.
- Rate ratio is the Indigenous rate divided by the Non-Indigenous rate and is used to compare the 2 service use rates. Rate difference reveals the gap between the 2 rates.
- The denominator for the proportion achieving all case management goals is the number of client groups with a case management plan. Denominator values for proportions are provided in the relevant National supplementary table.
- Previous years’ data can be found in the AIHW 2014–15 Specialist Homelessness Services Annual report.
Source: Specialist Homelessness Services Collection 2013–14 to 2015–16.
Indigenous clients 2015–16
Characteristics
1 in 4
Indigenous clients (23%) were children aged under 10.
1 in 2
Indigenous clients (54%) were aged under 25 compared with 41% of non-Indigenous clients.
2x
as many Indigenous female clients aged over 18 (42%, or 26,000) than male Indigenous clients (21%). By comparison, 46% of non-Indigenous clients were females over 18 and 29% were males.
1 in 4
Indigenous clients sought homelessness services because of a housing crisis (25%) and about 1 in 5 (22%) for the reason of domestic and family violence.
1 in 3
Indigenous clients were living as a single parent with a child or children (36%) when they approached an agency for support.
The different age structures of Indigenous and non-Indigenous clients is illustrated in Figure INDIGENOUS.1.
Figure INDIGENOUS.1: Clients by Indigenous status, by age and sex, 2015–16
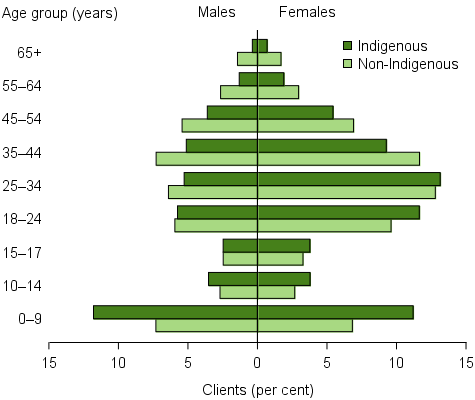
Source: Specialist Homelessness Services 2015–16, National Supplementary Table INDIGENOUS.1.
Services needed and provided
1 in 2
Indigenous clients (52%, or 32,000) needed short-term or emergency accommodation compared with 36% for non-Indigenous clients.
- For accommodation based assistance, apart from short-term or emergency accommodation, the need for other accommodation assistance was broadly similar between Indigenous and non-Indigenous clients (Figure INDIGENOUS.2).
- For general services, needs were higher for Indigenous clients when compared with non-Indigenous clients. For example, general services comprising meals (29% compared with 15%), laundry/shower facilities (27% compared with 13%) and transport (35% compared with 20%) were all notably higher for Indigenous clients.
Figure INDIGENOUS.2: Clients, by Indigenous status and by most needed services, 2015–16
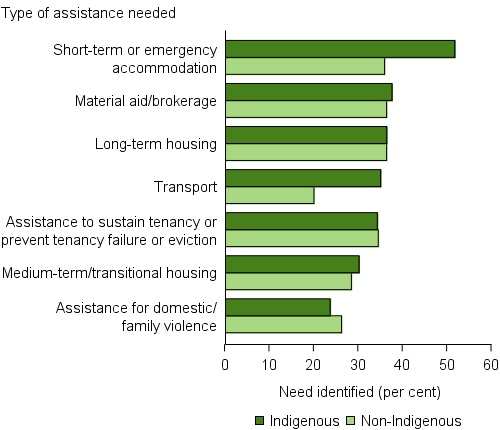
Note: Most needed excludes 'Other basic assistance', 'Advice/information’ and ‘Advocacy/liaison on behalf of client'.
Source: Specialist Homelessness Services 2014–15, National Supplementary Table INDIGENOUS.3.
Housing outcomes
For Indigenous clients who had ended support:
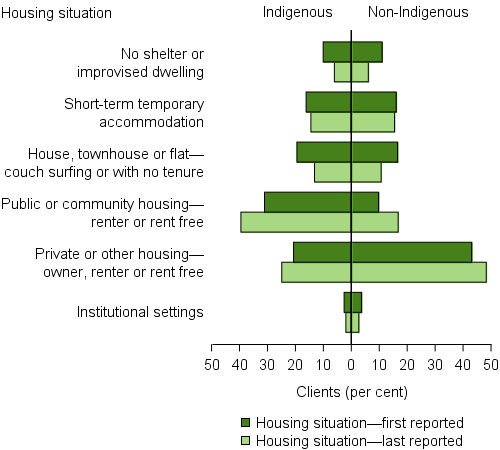
- The most common housing situation at the start of support was public or community housing (31%), compared with private or other housing for non-Indigenous clients (43%).
- The most common housing outcome following support was public or community housing (40%, or over 16,000) followed by private rental (25%, or over 10,000) (Figure INDIGENOUS.3). For non-Indigenous clients, the most common housing outcomes at the end of support were private rental (48%) followed by public or community housing (17%).
- There has been an improvement in housing outcomes for Indigenous clients when compared with the previous year. In 2015–16 around 2,900 (or 9%) more clients ended support in public or community housing and fewer clients were in short-term or emergency accommodation.
Figure INDIGENOUS.3: Clients, by Indigenous status and by housing situation at the beginning and end of support, 2015–16
Notes
- The SHSC classifies clients living with no shelter or improvised/ inadequate dwelling, short-term temporary accommodation, or in a house, townhouse, or flat with relatives (rent free) as homeless. Clients living in public or community housing (renter or rent free), private or other housing (renter or rent free), or in institutional settings are classified as housed.
- Proportions include only clients with closed support at the end of the reporting period.
Source: Specialist Homelessness Hervices 2015–16, National Supplementary Table INDIGENOUS.4.
Reference
- Australian Bureau of Statistics (ABS), 2012. Census of population and housing: estimating homelessness, 2011. ABS cat no. 2049.0. Canberra: ABS.