Clients with disability
The 2015 Survey of Disability, Ageing and Carers (SDAC) estimates that almost 1 in 5 Australians (18.3% of the total population) have disability. This estimate includes all those with any disability including mild and severe disabilities [1]. The SHSC identifies people with core activity limitations and their level of need for assistance in different life areas including those that may impact on housing and employment, and differentiates them from people without such limitations. The analysis of the availability and appropriateness of homelessness services for this group of clients allows for comparable information about people with disability across a range of government services.
Key findings in 2015–16
- There was a 12% increase in the number of clients; an estimated 10,000, people with disability sought assistance from homelessness agencies. This growth rate was higher than that of the general SHS population (9%), and New South Wales accounted for most of this increase (80%).
- The highest proportion of adult clients with disability were aged 45–54. This age group had similar proportions of male and female clients (48% male and 52% female), unlike the general SHS population (42% and 58%, respectively).
- Housing outcomes for clients with disability improved following support, with fewer people homeless (33%, down from 44% at the start of support).
- Most clients with disability ended support housed in private or other housing (34%). Public and community housing saw the greatest increase in client numbers to 28%, up from 19% at the start of support.
The reporting of disability in the SHSC
The SHSC disability questions are asked of all clients and are based on core activity limitations and whether the client has any need for assistance with these activities. In this report, people who identified that they have a limitation in core activities (self–care, mobility and/or communication) and who also reported that they always or sometimes needed assistance with one or more of these core activities are described as having disability. Details about measuring disability in the SHSC and the definition of a client with disability are provided in the Technical information section .
Clients with disability: 2013–14 to 2015–16
This is the third year for which information on clients based on core activity limitations together with their level of need for assistance has been collected. In 2015–16, of the 27,181 clients who had a core activity limitation, 9,812 clients (or 4% of all SHS clients) answered that they 'always/sometimes need help and/or supervision' with self–care, mobility or communication (Supplementary Table DIS.1). It is these 'clients with disability' who are described in this section.
Since reporting began on the disability indicator in the SHSC in 2013–14, the number of clients with disability has increased. The key trends identified over the 3 years have been:
- The number of clients with disability has increased by 41% across the 3 years (Table Disability Trends.1).
- Clients with disability aged 45–54 are the fastest growing adult age group, up 39% over the 3 years to 2015–16.
- The average number of services needed by a client with disability has consistently been higher than the general SHS population (around 10 per client with disability compared with about 7 per SHS client).
| 2013–14 | 2014–15 | 2015–16 | |
|---|---|---|---|
| Number of clients (proportion of all clients) | 6,979 (4) | 8,789 (4) | 9,812 (4) |
| Rate (per 10,000 population) | 3.0 | 3.7 | 4.1 |
| Housing situation at the beginning of first support period (proportion of all clients) | |||
| Homeless | 42 | 43 | 44 |
| At risk of homelessness | 58 | 57 | 56 |
| Length of support (median number of days) | 68 | 59 | 64 |
| Average number of support periods per client | 2.3 | 2.2 | 2.3 |
| Proportion receiving accommodation | 42 | 40 | 39 |
| Median number of nights accommodated | 58 | 55 | 55 |
| Proportion of a client group with a case management plan | 50 | 68 | 70 |
| Achievement of all case management goals (per cent) | 18 | 19 | 18 |
Notes
- Rates are crude rates based on the Australian estimated resident population (ERP) at 30 June of the reference year.
- The denominator for the proportion achieving all case management goals is the number of client groups with a case management plan. Denominator values for proportions are provided in the relevant National supplementary table.
Source: Specialist Homelessness Services Collection 2013–14 to 2015–16.
Clients with disability 2015–16
Support received by clients with disability was longer than the general SHS population, reflecting the more complex needs these clients present with. In 2015–16 clients with disability:
- Were supported for 64 days (median), significantly longer than the general SHS population (median 35 days).
- Were more likely to receive accommodation (39%) than the general SHS population (31%), and for those who did, the length of supported accommodation was much longer (median 55 nights compared with 33 nights for the general SHS population).
Client demographics
Of the 9,812 clients reporting disability in 2015–16:
44%
of clients with disability were homeless, similar to the general SHS population.
34%
were living alone when they approached homelessness services, more than the general SHS population (29%).
22%
of clients with disability were Indigenous, compared with 24% of all SHS clients.
2 in 3
clients with disability (66%) accessed services in Major cities and 1 in 5 (20%) in Inner regional areas. This was about the same distribution as the general SHS population (63% and 21%, respectively).
22%
reported housing crisis as the most common main reason clients with disability sought homelessness services.
2x as many people aged over 55
with disability (16%) sought assistance from SHS agencies, compared with the general SHS population (8%). And, unlike the general SHS population, there were similar proportions of male and female clients with disability.
The age and sex distribution of clients with disability compared with clients without disability is shown in Figure DIS.1.
Figure DIS.1: Clients with disability, by age and sex, 2015–16

Note: For further information on the quality of Disability data, specifically for children aged 0–9, see the Data Quality Statement.
Source: Specialist Homelessness Services 2015–16, National Supplementary Table DIS.3.
States and territories
- Over one–third of these clients with disability accessed services in Victoria (36%, or 3,600 clients). This was followed by New South Wales (25%) and Queensland (13%) (Figure DIS.2).
- Compared with 2014–15, New South Wales and Tasmania had the largest increase in clients with disability (49% and 39%, respectively). Note that this is in line with reported increases in overall client numbers in 2015–16 of 44% in New South Wales and 7% in Tasmania).
- The Northern Territory (11.6 per 10,000 people) and Tasmania (9.1) had the highest rates of clients with disability while Queensland (2.7) and South Australia (3.2) had the lowest rates.
Figure DIS.2: Clients with disability, by state and territory, 2015–16
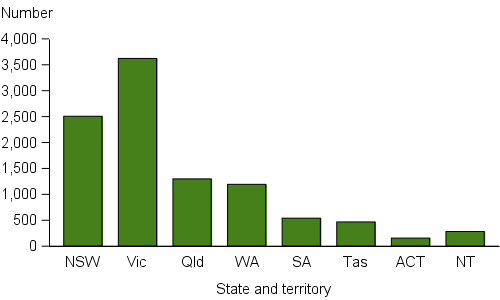
Source: Specialist Homelessness Services 2015–16, National Supplementary Table DIS.4.
Main source of income
Of clients aged 15 and over with disability (nearly 6,800), 88% reported that their main source of income was a government payment, in particular:
- Disability Support Pension (47%) (compared with 17% of all SHS clients)
- New Start Allowance (19%) (compared with 28% of all SHS clients)
- Age Pension (7%) (compared with 3% of all SHS clients)
- Department of Veteran Affairs Disability Pension (3%) (compared with 1% of all SHS clients)
- Clients who require assistance for disability were less likely to report their main source of income as the parenting payment (5% compared with 19% of all SHS clients).
A larger proportion of male clients with disability (52%) reported that their main source of income was from the Disability Support Pension, compared with females (43%).
Employment status / educational status
Of clients aged 15 and over with disability (nearly 6,800):
- The majority were not in the workforce (59%). A further 37% were unemployed.
- Only 3% of these clients were employed. By comparison, 11% of the SHS client population were employed.
- Of those aged 5–14, 22% were not enrolled in education compared with 16% of the general SHS population. The proportion aged 15–24 who were not enrolled in education was similar to the general SHS client group (68% and 65%, respectively).
Source of referral
- Similar to other SHS clients, most of these clients seek support without a formal referral (32%). However, where a referral was made, it was most commonly made by a specialist homelessness agency/outreach worker (15%), followed by another (government/non–government) agency (12%), while a further 8% were referred by family and/or friends.
- Clients with disability were less likely to be referred to homelessness services by police (3%) than the general SHS population (9%).
Reasons for seeking assistance
- The most common main reason this group of clients reported for seeking assistance was housing crisis (22%), similar to the SHS population (23%).
- 17% reported the main reason they had sought assistance was for domestic and family violence reasons, much lower than the general SHS population (26%).
Services needed and provided
- For clients with disability the most common need identified was for material aid/brokerage (over 4,500, or 47%), followed by long–term housing (45%), short–term or emergency accommodation (44%) and 'assistance to sustain tenancy or prevent tenancy failure or eviction' (42%) (Figure DIS.3).
- Most of these identified needs were provided: 87% (or nearly 4,000) of the need for material aid/brokerage; 63% of the need for short–term or emergency accommodation; and, 83% of the need for 'assistance to sustain tenancy or prevent tenancy failure or eviction'.
- Over 1 in 5 (22%, or over 2,000) clients were identified as in need of health/medical services and 19% were identified as in need of mental health services. Over half of these identified needs were provided–61% for health/medical services and 54% of mental health–related services.
- Just 4% (or about 400) of these clients needed support and assistance specifically for their physical disability and similarly, 4% needed services specifically for their intellectual disability. About half (49%) of the identified need for disability services was met.
- Clients with disability, were more likely to need family relationship assistance (24%, or over 2,300), assistance with challenging social/ behavioural problems (22%) and assistance for trauma (16%) than the broader SHS population (18%, 13%, 11%, respectively).
Figure DIS.3: Clients with disability, by most needed services and service provision status, 2015–16
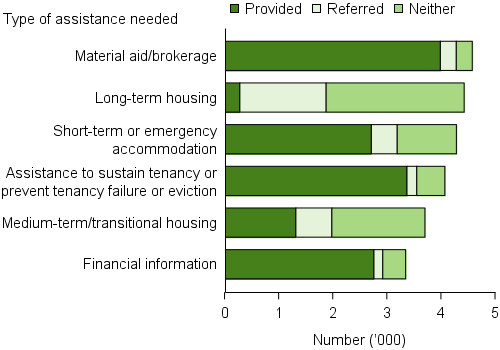
Note: Excludes ‘Other basic assistance’, ‘Advice/information’, and ‘Advocacy/liaison on behalf of client’.
Source: Specialist Homelessness Services 2015–16, National Supplementary Table DIS.5.
Previous experience of homelessness
- Two–fifths (40%) of clients with disability indicated they had experienced an episode of homelessness in the month before their support commenced. This is similar to the general SHS population (39%).
Housing situation at the start of support
- Over two–fifths (44%) of all clients with disability were homeless when their support commenced, the same proportion as the general SHS population (Figure DIS.4).
- Almost 1 in 3 (29%) clients with disability were living in private housing at the start of their support, followed by short–term accommodation (18%).
Figure DIS.4: Clients with disability, by housing situation at beginning of support, 2015–16
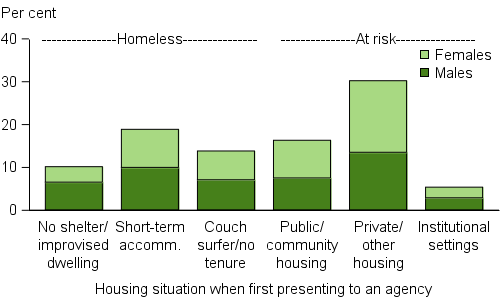
Note: Per cent calculations based on Total clients, excluding ‘Not stated’.
Source: Specialist Homelessness Services 2015–16, National Supplementary Table DIS.6.
Housing and other outcomes
Of those clients with disability whose support had ended (about 7,000 clients):
- 44% were homeless at the start of support and this decreased to 33% by the end of support (Supplementary Table DIS.7).
- 34% (or about 2,100 clients) ended support in private housing and 28% (or about 1,700 clients) were housed in public or community housing.
- Data for this group indicate that clients' labour force status and educational enrolment status does not change following support from SHS.
- For example, the proportions of these clients unemployed or not in the labour force remain unchanged at the end of support (36% unemployed, 60% not in the labour force).
- Of those who identified needing assistance to obtain a government payment or allowance, there was a decrease in the proportion with no income (12% to 7%) and a reduction in those awaiting government benefit (5% to 2%).
Reference
- Australian Bureau of Statistics 2016. Disability, ageing and carers, Australia. First Results, 2015. ABS cat no. 4430.0. Canberra: ABS.