Young people presenting alone
Young people are some of the most vulnerable people in our society and experience significant rates of homelessness [1]. Traumatic and abusive experiences in the home as a young person have been identified as one of the major pathways into longer term homelessness for adults [2].
43,165 young people
aged 15–24 approached specialist homelessness agencies alone; over half (52%) were homeless.
Key findings in 2015–16
- Over 43,000 young people aged 15 to 24 approached a specialist homelessness service alone in 2015–16; a small increase (3%) from the previous year, but smaller than the growth rate of the general SHS population (9%).
- A higher proportion were aged 15–17 than in 2014–15; around 9,700 (23%) compared with 8,900 (21%).
- 1 in 4 (24%) young people presenting alone sought assistance because of unstable housing (housing crisis).
- Housing outcomes improved: Fewer young clients were homeless following support (41%) with the largest decrease in 'couch surfers', falling from 30% to 21%. The largest improvement in housing situation was for young clients in private or other housing-up from 32% at the start of support to 42% at the end of support.
Young people presenting alone: 2011–12 to 2015–16
Over the 5 years since the beginning of the SHS collection in 2011–12, the number of young people presenting alone to an agency has fluctuated. Key trends over these 5 years have been:
- The rate of service use by young people presenting alone to SHS agencies has decreased from 20 young people per 10,000 population in 2011–12 to 18 young people per 10,000 in 2015–16 (Table Young Trends.1).
- While the overall rate of young people presenting alone has been decreasing, the rate of Indigenous young people presenting alone has been increasing, from 1 in 5 (21%) in 2011–12 to 1 in 4 (25%) in 2015–16. While all regional areas have reported increasing rates of Indigenous young people presenting alone, the largest growth rates have been in Major Cities(9.1% on average each year) and Inner Regionalareas (6.1% each year). By comparison, the only regional area to report an increase in the rate of non-Indigenous young people presenting alone was Major Cities(1.8%).
- Domestic and family violence (15% in 2015–16) or unstable housing (housing crisis 24% in 2015–16) remain the most common main reasons for young people presenting alone to seek assistance.
- Following initial increases, the median number of days of support and nights of accommodation for these clients have remained steady over the past 3 years.
- While the proportion of young people with a case management plan has increased, this group remains one of the least likely of all priority groups to achieve all their goals.
| 2011–12 | 2012–13 | 2013–14 | 2014–15 | 2015–16 | |
|---|---|---|---|---|---|
| Number of clients (proportion of all clients) | 43,531 (18) | 45,071 (18) | 44,414 (17) | 41,780 (16) | 43,165 (15) |
| Rate (per 10,000 population) | 19.5 | 19.8 | 19.2 | 17.8 | 18.2 |
| Housing situation at the beginning of first support period (all clients) (per cent) | |||||
| Homeless | 50 | 51 | 50 | 52 | 52 |
| At risk of homelessness | 50 | 49 | 50 | 48 | 48 |
| Length of support (median number of days) | 35 | 41 | 46 | 44 | 44 |
| Average number of support periods per client | 1.6 | 1.7 | 1.7 | 1.8 | 1.8 |
| Proportion receiving accommodation | 39 | 37 | 36 | 35 | 34 |
| Median number of nights accommodated | 35 | 36 | 41 | 41 | 41 |
| Proportion of a client group with a case management plan | 54 | 54 | 57 | 58 | 60 |
| Achievement of all cases management goals (per cent) | 16 | 16 | 17 | 20 | 18 |
Notes
- Rates are crude rates based on the Australian estimated resident population (ERP) at 30 June of the reference year.
- The denominator for the proportion achieving all case management goals is the number of client groups with a case management plan. Denominator values for proportions are provided in the relevant National supplementary table.
Source: Specialist Homelessness Services Collection 2011–12 to 2015–16.
Young people presenting alone 2015–16
In 2015–16 43,165 young people (aged 15–24) were alone when they approached a specialist homelessness agency; 1 in 4 (25%) were Indigenous.
- Nationally, there was a 3% increase in young people presenting alone since 2014–15. This was primarily due to increases in client numbers in New South Wales (26%) and the Northern Territory (18%). All other jurisdictions reported a decrease in young people presenting alone to services.
- Forty-one per cent (or nearly 19,000) of these clients lived alone at the time of approaching a specialist homelessness agency and a further 15% were living as a single parent.
- The majority of young people presenting alone were female (62%) and 78% were aged between 18 and 24, similar to 2014–15.
Services needed and provided
- For young people presenting alone, the most common needs identified were accommodation related, including short-term or emergency accommodation (41% or around 17,800 clients), long-term accommodation (37%), and medium-term/transitional housing (36%) (Figure YOUNG.1).
- Just over half (56%) of young people presenting alone who needed short-term or emergency housing were provided with it. This proportion is lower than the general SHS client population (62%).
- Compared with the overall SHS population, young people presenting alone were much more likely to be identified as needing assistance with living skills/personal development (34% compared with 20%), education (20% compared with 8%), employment (14% compared with 5%) and training (12% compared with 4%).
- The need for these services was unmet in some cases (17% for those who identified needs for education, 22% for employment and 20% for training assistance).
Figure YOUNG.1: Young people presenting alone, by top 6 most needed services and service provision status, 2015–16
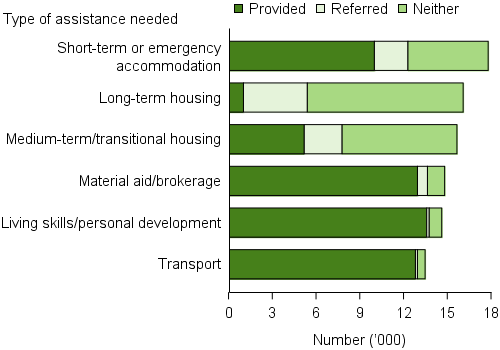
Note: Excludes 'Other basic assistance', 'Advice/information', and 'Advocacy/liaison on behalf of client'.
Source: Specialist Homelessness Services 2015–16, National Supplementary Table YOUNG.3.
Housing outcomes
For young people presenting alone whose support had ended:
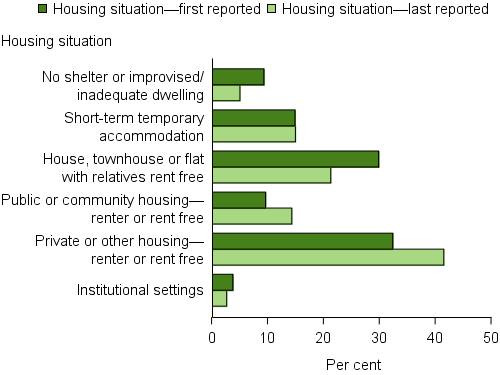
- The rate of homelessness fell from 54% at the beginning of support to 41% at the end of support (Figure YOUNG.2).
- The most common housing outcome for young people presenting alone was private or other housing (as a renter, rent free or owner) (42%)—an increase from 32% at the beginning of support.
- At the beginning of support, 30% of young people who presented alone were 'couch surfing' or staying in housing with no tenure. This reduced to 21% by the end of support.
Figure YOUNG.2: Young people presenting alone, by housing situation at beginning of support and end of support, 2015–16
Notes
- The SHSC classifies clients living with no shelter or improvised/ inadequate dwelling, short-term temporary accommodation, or in a house, townhouse, or flat with relatives (rent free) as homeless. Clients living in public or community housing (renter or rent free), private or other housing (renter or rent free), or in institutional settings are classified as housed.
- Proportions include only clients with closed support at the end of the reporting period.
Source: Specialist Homelessness Services 2015–16, National Supplementary Table YOUNG.4.
References
- Australian Bureau of Statistics (ABS) 2012. Census of population and housing: estimating homelessness, 2011. ABS cat. No. 2049.0. Canberra: ABS.
- Chamberlain & Johnson 2011. Pathways into adult homelessness. Journal of Sociology, 1–18 DOI: 10.1177/1440783311422458.