Clients, services and outcomes
Specialist homelessness agencies provide a wide range of services to assist those who are homeless or at risk of homelessness, ranging from general support and assistance to immediate crisis accommodation. This section outlines the characteristics of all clients assisted by specialist homelessness agencies in 2015–16, describes their needs for assistance and the services they received. It also provides some key trends for the 5 years from 2011–12 (the start of the Specialist Homelessness Services Collection-SHSC) to 2015–16.
Key findings in 2015–16
- Client numbers were up 9% from 2014–15 to 279,196, with support rising in parallel.
- Clients are getting older. One in 5 clients (over 54,000) were aged over 45 years; this is a 13% increase in clients in this age group compared with the previous year. By comparison, there was an 8% increase in clients aged under 45 years over the same period.
- While the median length of support has increased from 33 to 35 days compared with 2014–15, the proportion of clients receiving accommodation has decreased (31% compared with 33%) and so has the length of their accommodation (33 nights compared with 34).
- Agencies were best able to assist clients living in private or other housing to remain housed (79% of these clients remained housed, or nearly 57,000).
- The average amount of financial assistance provided totalled $520 per client, up from $468 in 2014–15 (not adjusted for inflation).
Clients: 2011–12 to 2015–16
Over 800,000
clients have been supported by homelessness agencies between 2011–12 and 2015–16.
The estimated number of clients assisted by agencies each year has increased from 236,000 in 2011–12 to 279,000 in 2015–16. This represents an average annual growth rate of 4.2%.
Because SHSC data provide a measure of the service response, increases in client numbers generally reflect the increased availability and accessibility of services, not necessarily a change in the underlying level of homelessness in Australia. The rate of specialist homelessness service use has increased since the start of the collection from 106 people per 10,000 in 2011–12 to 117 in 2015–16 (Supplementary historical tables). That is, from 1 in 95 people in the Australian population to 1 in 85.
The characteristics of clients, the main reason for seeking support, and the services provided to clients, have remained relatively stable over the 5 years. There have, however, been some notable changes:
- The median number of days a client was supported has increased from 29 days in 2011–12 to 35 days in 2015–16, an average increase each year of 4.8% (Table Client Trends.1).
- The proportion of clients who were identified as needing assistance to sustain tenancy or prevent tenancy failure or eviction increased from 28% in 2011–12 to 33% in 2015–16.
- The proportion of males who were homeless on presentation decreased from 56% of males in 2011–12 to 51% in 2015–16. The proportion of females who were homeless on presentation increased slightly from 36% of females in 2011–12 and 38% in 2015–16.
- Between 2011–12 and 2015–16 there has been a small but steady increase each year in the proportion of clients aged over 45 years from 17% (or 40,000) in 2011–12 to nearly 1 in 5 clients (19%, or over 54,000) in 2015–16.
- The 65 and over age group experienced the greatest rate increase. The proportion of clients aged 65 and over increased from 2% (or nearly 5,000) in 2011–12, to 3% (or nearly 7,500) in 2015–16. For Indigenous clients aged over 65, the average annual rate of growth is higher than the non-Indigenous rate (18% each year compared with 14%, respectively).
- The proportion of clients ending support in some form of private housing increased from 39% in 2011–12 to 43% in 2015–16.
- The proportion of clients ending support having achieved no case management goals has remained steady since 2012–13 at about 7%.
| 2011–12 | 2012–13 | 2013–14 | 2014–15 | 2015–16 | |
|---|---|---|---|---|---|
| Number of clients | 236,429 | 244,176 | 254,001 | 255,657 | 279,196 |
| Rate (per 10,000 population) | 105.8 | 107.4 | 109.9 | 109.0 | 117.4 |
| Housing situation at the beginning of first support period (proportion of all clients) | |||||
| Homeless | 41 | 43 | 42 | 43 | 44 |
| At risk of homelessness | 59 | 57 | 58 | 57 | 56 |
| Total days of support (millions) | 18.1 | 20.6 | 20.1 | 19.7 | 22.2 |
| Length of support (median number of days) | 29 | 31 | 33 | 33 | 35 |
| Proportion receiving accommodation | 36 | 36 | 34 | 33 | 31 |
| Total nights of accommodation (millions) | 6.8 | 7.0 | 7.0 | 6.6 | 7.0 |
| Median number of nights accommodated | 35 | 34 | 35 | 34 | 33 |
| Achievement of all case management goals (per cent) | 22 | 22 | 24 | 26 | 23 |
Notes
- Rates are crude rates based on the Australian estimated resident population (ERP) at 30 June of the reference year.
- The denominator for the proportion achieving all case management goals is the number of client groups with a case management plan (Supplementary table CLIENTS.26). Denominator values for proportions are provided in the relevant National supplementary table.
Source: Specialist Homelessness Services Collection 2011–12 to 2015–16.
Clients, services and outcomes 2015–16
Support periods
Data collected by specialist homelessness agencies are based on support periods, or episodes of assistance provided to clients (see Technical information for further information). Clients may have had more than one support period in 2015–16, either with the same agency at different times, or with different agencies.
In 2015–16 more support was provided by homelessness agencies than in 2014–15, and this increase was consistent with agencies assisting more clients.
- In 2015–16, clients assisted by homelessness agencies were supported in 477,831 support periods, a 9% rise compared with 2014–15. The number of support periods has increased by an average of 5.3% each year since the collection began in 2011–12.
- The majority of clients in 2015–16 had only 1 support period (68%), while 18% had 2 support periods, 7% had 3 periods and 7% had 4 or more. The number of support periods per client is consistent with the previous year (1.7 support periods per client).
- The majority of support periods opened and closed in 2015–16 (77%, or nearly 370,000). An additional 11% of support periods opened during the year and remained open on 30 June 2016. Just 1.7% remained open throughout the 2015–16 reporting period (Figure CLIENTS.1).
Figure CLIENTS.1: Support periods, by indicative duration over the reporting period, 2015–16
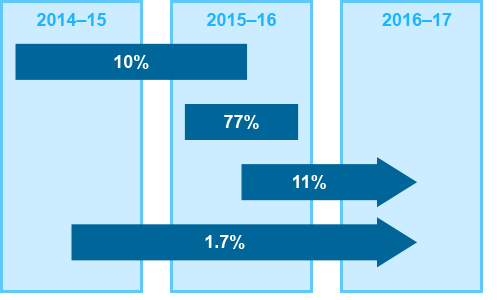
Source: Specialist Homelessness Services 2015–16, National supplementary table CLIENTS.19
Number of days clients received support
3 in 10
clients (29%) received over 90 days support.
In 2015–16, clients were suppoted for an average of 79 days in total, either as consecutive days or over multiple periods of support. This is up from 76 days in 2014–15. The median number of support days has also increased over this time period (from 33 to 35 days).
- Males (35 days) and females (34 days) received a similar length of support.
- The needs of some clients can be met relatively quickly, but for those with more complex issues significantly more support is needed. About one-third of clients (30%, or about 85,000) received between 6 and 45 days of support during the year; 25% received support for 5 or fewer days. Fourteen per cent received over 180 days of support during 2015–16; the same proportion received support for 91–180 days (14%).
Reasons that support periods ended
- Around half (54%) of support periods ended in 2015–16 because the client's immediate needs were met or case management goals were achieved.
- A quarter (25%) ended because the client no longer requested assistance.
- A further 13% closed because the client was referred to another specialist homelessness agency and another 12% closed because contact was lost with the client (Figure CLIENTS.2).
Figure CLIENTS.2: Clients by reason support period ended (top 6), 2015–16
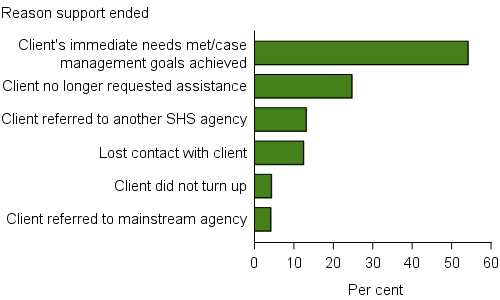
Notes
- Top 6 excludes 'Other' reason.
- Includes clients with any closed support at the end of the reporting period.
Source: Specialist Homelessness Services 2015–16, National Supplementary Table CLIENTS.21.
Characteristics of clients
In 2015–16, specialist homelessness agencies provided assistance to an estimated 279,196 clients, equivalent to 1 in 85 people in the Australian population (Supplementary Table CLIENTS.2). This represents an increase since 2014–15, from 1 in 92.
Age and sex
6 in 10
clients were female (59%, or almost 166,000).
Nearly 3 in 10
clients were aged under 18 (28%, or nearly 79,000).
1 in 6
were children under the age of 10 (16%, or nearly 46,000 clients).
Clients aged 25–34
were the largest age group (19%).
- The majority (59%) of clients in 2015–16 were female, the same as in 2014–15.
- The rate of service use was higher for females; 1 in 72 females in the Australian population received specialist homelessness services, and 1 in 104 males.
- Females aged 18–24 years continue to have the highest rate of service use, at 1 in 40 females in that age group across the Australian population.
- For males the highest rate of service use was youth aged 15–17 (1 in 65 males in the Australian population aged 15–17).
Figure CLIENTS.3: Clients, by age and sex, 2015–16
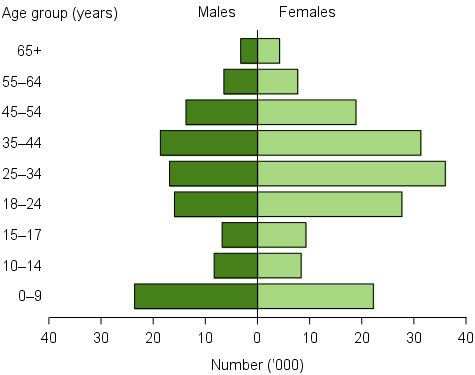
Source: Specialist Homelessness Services 2015–16, National Supplementary Table CLIENTS.1.
Indigenous status
1 in 4
clients were Indigenous.
- Aboriginal and Torres Strait Islander people continue to be over-represented among specialist homelessness services clients, with nearly a quarter of clients (24%, or 61,700) who provided information on their Indigenous status identified as being of Aboriginal and/or Torres Strait Islander origin. By comparison, 3% of the population identify as Aboriginal and Torres Strait Islanders [1].
Further information about Indigenous clients can be found in the Indigenous clients section.
State and territory of clients
- The largest number of clients was in Victoria (105,287), followed by New South Wales (69,715) and Queensland (42,543) (Supplementary Table CLIENTS.2).
- Nationally, the number of SHS clients increased by 9%, or 23,539. This was due largely to a significant increase in client numbers in New South Wales (44%, or 21,453). Queensland (-4%), South Australia (-1%) and the Australian Capital Territory (-7%) all reported decreases in client numbers compared with 2014–15. The increase in client numbers in New South Wales is largely a result of the consolidation of new post-reform service models. As outlined in the Data Quality Statement caution should be used when making comparisons of 2014–15 data with other years' figures for New South Wales and with data for other states and territories.
- New, first time clients accounted for 53% of the national total with 47% of clients having sought assistance at some time in the previous 4 years. The proportion of new clients varied across jurisdictions with New South Wales reporting the highest proportion of new clients (60%) and South Australia and the Australian Capital Territory the lowest (both 43%).
- Nationally there have been large increases in the total numbers of both support days and accommodation nights compared with 2014–15. There were over 2.5 million more days of support and over 400,000 more nights of accommodation provided in 2015–16. New South Wales was responsible for the majority of these increases (2.2 million days of support and 307,000 nights of accommodation). As outlined in the Data Quality Statement caution should be used when making comparisons of 2014-15 data with other years' figures for New South Wales and with data for other states and territories.
- The highest rates of estimated service use occurred in the Northern Territory (where there were 332 clients per 10,000 people), followed by Victoria (177 clients per 10,000 people) and Tasmania (152 clients per 10,000 people) (Figure CLIENTS.4).
- New South Wales and Tasmania had on average the largest growth in rates of service use each year since 2011–12 (average growth of 6% each year).
- Females had higher rates of service use than males in all states and territories. The Northern Territory had the most pronounced difference between males and females, where 447 per 10,000 females received services compared with 230 per 10,000 males (Supplementary Table CLIENTS.2).
Figure CLIENTS.4: Client service use per 10,000 population, by state and territory, 2015–16
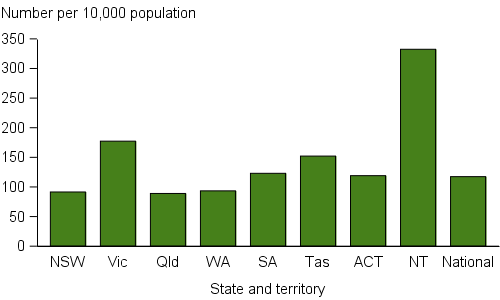
Note: Rates are crude rates as detailed in Technical information.
Source: Specialist Homelessness Services 2015–16, National Supplementary Table CLIENTS.1.
Country of birth
- Most clients of specialist homelessness agencies were born in Australia (86%, or nearly 206,000) (Supplementary Table CLIENTS.3). This proportion is higher than the general Australian population, of whom 72% are born in Australia [2].
- Of those clients who reported their country of birth and were born overseas, the most common country of birth was New Zealand (2%) (Supplementary Table CLIENTS.4). Over half of the clients (52%) who were born overseas had arrived in Australia prior to 2007 (Supplementary Table CLIENTS.5).
Living arrangements
- The most common living arrangement reported by clients was 'One parent with 1 or more children' (34%, or nearly 88,000), followed by 'lone persons' (29%, or nearly 75,000) and couples with a child or children (13%, or nearly 33,000) (Figure CLIENTS.5).
- Female clients were more likely than male clients to be living as a single parent with a child or children (70% female), while males were more likely than females to be living alone (57% male) (Supplementary Table CLIENTS.6).
Figure CLIENTS.5: Clients, by living arrangement, 2015–16
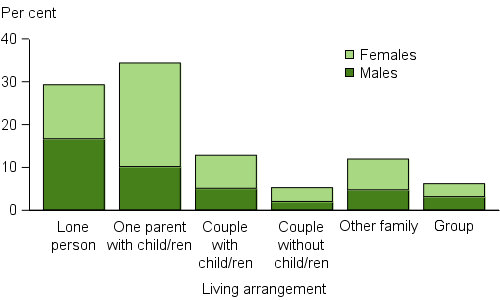
Source: Specialist Homelessness Services 2015–16, National Supplementary Table CLIENTS.6.
Housing situation
1 in 3
people (34%) who sought assistance from Specialist Homelessness Services were living in private or other housing (renter, rent free or owner) at the time.
- Among those whose housing status at the beginning of their first support period was known in 2015–16 (89% of clients), 44% (108,500 clients) were homeless and 56% (over 140,000 clients) were classified as at risk of homelessness (Figure CLIENTS.6).
- People living in private or other housing (renter, rent free, or owner) (34%) were the most common group presenting to agencies for assistance.
- For those clients who first presented to an agency reporting no shelter/improvised dwelling (24,000 clients), 45% were sleeping in no dwelling, either on the street, in a park or out in the open and just over 1 in 5 were sleeping in a car (22%).
Figure CLIENTS.6: Clients, by housing situation at the beginning of support, 2015–16
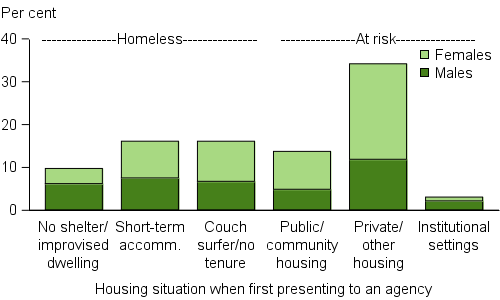
Notes
- Per cent calculations based on Total clients, excluding ‘Not stated’.
- Housing situation ‘Other’ not shown.
Source: Specialist Homelessness Services 2015–16, National Supplementary Table CLIENTS.7.
Source of referral
- In 2015–16, nearly 180,000 clients, almost 2 in 3 (65%) were formally referred to a specialist homelessness agency.
- Figure CLIENTS.7 shows that the most common referral source was by either another specialist homelessness agency or outreach worker (13%), other agency (government or non-government) (10%), or by the police (9%).
Figure CLIENTS.7: Clients, by source of referral (top 6), 2015–16
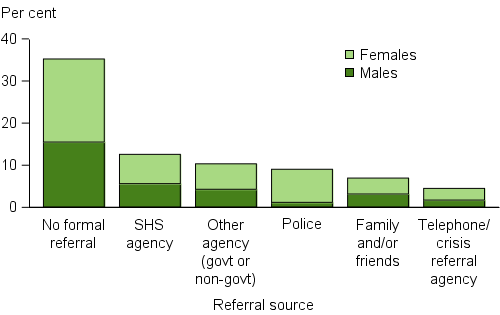
Note: Top 6 excludes formal referral source ‘Other’.
Source: Specialist Homelessness Services 2015–16, National Supplementary Table CLIENTS.9.
Main source of income
- A high proportion of clients aged 15 and over were receiving some form of government payment as their main income source at the time they sought support. The most common government payments were Newstart Allowance (28%, or nearly 51,000), Parenting Payment (19%, or about 34,000) and Disability Support Pension (17%, or nearly 31,000).
- A total of 7% reported income from employment and 9% of clients reported having no income.
Education
- Over half of young people aged 5–24 (54%, or over 45,000) were enrolled in education.
- 16% of clients aged 5–14 (about 5,000) were not enrolled in education—1 in 7 (15%) children aged 6 were not in school.
- Among those clients aged over 25, 4% were enrolled in some form of education—mostly vocational education or training.
- 30% of clients aged 15–24 were not in some form of education or employment.
Labour force
- The proportion of clients not in the labour force at the beginning of support in 2015–16 was slightly lower than in 2014–15 (43% and 45%, respectively) (Figure CLIENTS.8).
- About 82,000 (46%) clients aged 15 or over were unemployed at the beginning of support.
- 11% of clients were employed; of these, around 3 in 5 were employed on a part-time basis (62%).
- The main differences between male and female clients were that female clients were more likely to report not being in the labour force (47% females and 38% males); however, females were also more likely to be employed than males (12% compared with 8%).
Figure CLIENTS.8: Clients aged 15 and over, by labour force status at the beginning of support, 2015–16
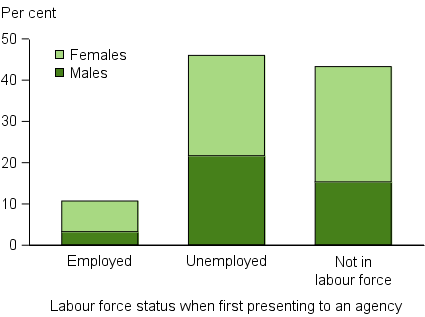
Source: Specialist Homelessness Services 2015–16, National Supplementary Table CLIENTS.12.
Clients' needs for assistance and services provided
In the SHSC, information is captured about clients' needs for services from 2 perspectives:
Technical information and glossary provides more information about how clients' needs for assistance are captured in the SHSC.
Services provided to clients range from the direct provision of accommodation, such as a bed in a shelter, to specialised services such as counselling and legal support. These services are generally either provided to the client directly by the agency or the client is referred to another service. The Unmet demand section provides further information about clients' needs that went unmet.
Reasons for seeking assistance
Accommodation issues
were identified by over half of clients (56%, or nearly 155,000) as a reason for seeking assistance.
- Over half of clients (56%) identified accommodation as a reason for seeking assistance, an increase of 2 percentage points from 2014–15.
- 'Housing crisis' was identified by 43% of clients as a reason for seeking assistance.
- 61% of clients identified housing affordability stress and/or financial difficulties as a reason for seeking assistance (Figure CLIENTS.9).
- Half (51%) of all SHS clients (about 140,000) identified interpersonal relationships as a reason for seeking support; within this group domestic and family violence and/or relationship/family breakdown were identified for 57% of clients.
- Health issues remain one of the common reasons clients seek assistance. Mental health, medical issues or problematic substance use were recorded as one of the reasons for seeking assistance for over 1 in 5 (22%) clients.
- Lack of family or community support was one of the reasons for seeking support for 17% of clients.
Figure CLIENTS.9: Clients, by all reasons for seeking assistance (top 6), 2015–16
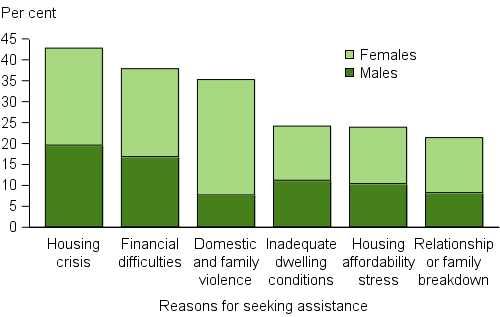
Source: Specialist Homelessness Services 2015–16, National Supplementary Table CLIENTS.13.
While clients can identify a number of reasons for seeking assistance, agencies also record the main reason for seeking assistance.
- Domestic and family violence was identified as the main reason for seeking assistance (Figure CLIENTS.10) for one-quarter of clients (26% or about 72,000). For more information see Clients who have experienced domestic and family violence.
- Housing crisis was reported by 23% of clients as the main reason for seeking assistance.
Figure CLIENTS.10: Clients, by main reason for seeking assistance (top 6), 2015–16
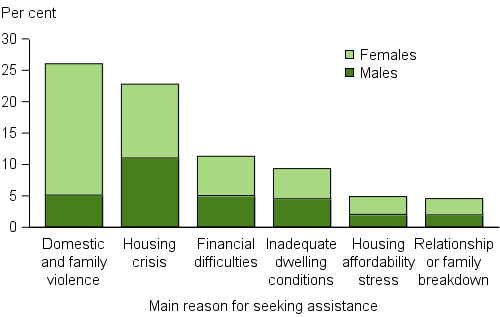
Source: Specialist Homelessness Services 2015–16, National Supplementary Table CLIENTS.14.
General support and assistance
Some types of assistance provided by SHS agencies can be described as 'general support and assistance' (as opposed to more specialised services). These include advice and information, material aid, meals and living skills.
- Of all assistance needed by clients, advice and information continued to be the most common, identified as a need by 80% of clients (over 222,000) in 2015–16. The next most common was advocacy and liaison, needed by 54% clients (nearly 150,000), and 35% of clients (over 97,000) needed material aid/brokerage (Figure CLIENTS.11).
- Advice/information and advocacy/liaison services were provided directly by the agency for almost all clients who needed them. This differs from some specialised services (such as legal information and training or employment assistance) for which clients were more often referred to another agency.
- In 2015–16 there were about 20,000 more requests for assistance with domestic and family violence, family/ relationship assistance and assistance for trauma. There were about 39,000 more requests for accommodation services compared with 2014–15.
Figure CLIENTS.11: Clients, by most needed general services and service provision status (top 10), 2015–16
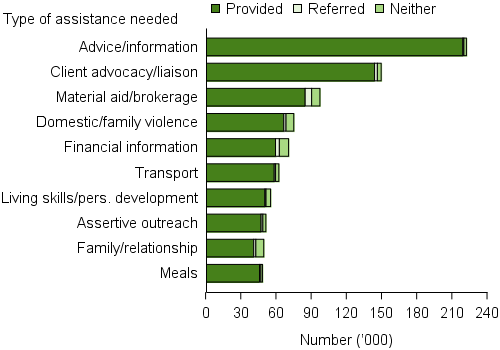
Note: Top 10 excludes 'Other basic assistance'.
Source: Specialist Homelessness Services 2015–16, National Supplementary Table CLIENTS.15.
Housing/accommodation services
Housing and accommodation services provided by agencies include:
- short-term or emergency accommodation
- medium-term/transitional housing
- long-term housing
- assistance to sustain tenancy or prevent tenancy failure or eviction.
In 2015–16, 56% of SHS clients identified a need for accommodation services. Of these 157,000 clients:
- 87,000 (or 56%) were provided with accommodation by the agency.
- 25,000 (or 16%) were referred to another agency.
- 45,000 (or 29%) were neither provided with assistance or referred. These clients are further described in the Unmet demand section.
The proportion of SHS clients in 2015–16 who identified a need for accommodation assistance was the same as 2014–15 (56%).
However, the proportion of these clients who were subsequently provided with accommodation has decreased in 2015–16 (56% compared with 60% in 2014–15).
Nearly 7.0 million nights of accommodation were provided to clients in 2015–16, about 0.4 million (or 6%) more than 2014–15. Total nights of accommodation may represent more than one period of accommodation during 2015–16 (Supplementary Table CLIENTS.16) (see Technical information for details on how length of accommodation is calculated).
- The median length of accommodation received by clients was 33 nights.
- Most of the accommodation was provided in medium-term/ transitional housing (56%) followed by short-term and emergency accommodation (37%) and long-term housing (7%).
Assistance to sustain tenancy/prevent eviction was needed by 33% of clients at some stage during their support period in 2015–16. This group includes those who were still housed when they approached an SHS agency and were supported to remain in that housing. It also includes those who identified a need for accommodation, were assisted to secure new housing and then supported to sustain that housing.
- Most clients (81%, or 75,000) received assistance to sustain housing directly from the specialist homelessness agency.
- There has been, on average, a 5% increase in the proportion of clients needing assistance to sustain tenancy each year since 2011–12.
Specialised services
- Health/medical services were identified as a need by 1 in 10 clients (or about 27,000) and was one of the services most often referred (24%) (Figure CLIENTS.12).
- There has been little change in the most common specialised services needed and provided over the past 5 years. For example, health and medical services, mental health services and specialist counselling have been the most commonly needed services.
Figure CLIENTS.12: Clients, by most needed specialised services and service provision status (top 10), 2015–16
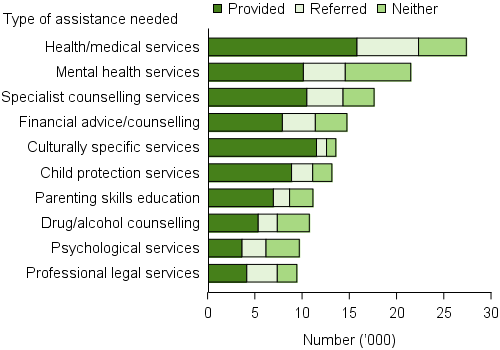
Note: Excludes 'Other specialised service'.
Source: Specialist Homelessness Services 2015–16, National Supplementary Table CLIENTS.15.
Financial assistance
$29.6 million
in financial assistance was provided to clients in 2015–16, an average of $520 per client requesting financial assistance, and an increase from the previous year ($468, unadjusted for inflation).
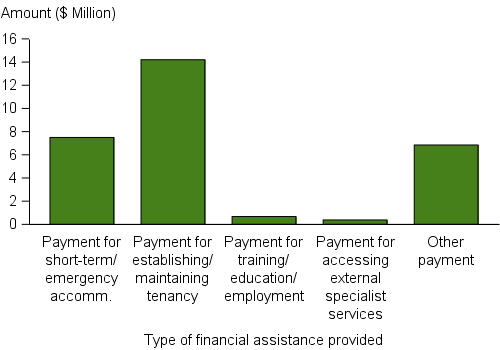
- A total of $29.6 million in financial assistance was provided to clients in 2015–16 (Figure CLIENTS.13), an increase in nominal terms to the previous 3 financial years.
- Almost three quarters of the financial assistance was used to assist clients with housing:
- Almost half (48%, or $14.2 million) of the financial assistance was used to assist clients to establish or maintain a tenancy.
- A quarter of this funding (25%, or $7.5 million) was used to provide short-term or emergency accommodation.
- These funding proportions are consistent with expenditure patterns in 2014–15.
Figure CLIENTS.13: Total amount of financial assistance provided to clients, by payment type, 2015–16
Source: Specialist Homelessness Services 2015–16, National Supplementary Table CLIENTS.17.
Outcomes following support
This section looks at clients who ceased receiving support during the year—their support periods had closed and they did not have ongoing support at the end of the year. The outcomes presented here are changes in clients' situations with reference to the start and end of support. Many clients had long periods of support or multiple support periods during the year and they may have had a number of changes over the course of their support (for example, their housing situation may change a number of times during support). These changes within the year are not reflected in the data presented here.
Clients whose support period both opened and closed in 2015–16 accounted for 77% of all clients (Figure CLIENTS.1). A proportion of these clients may seek assistance again in 2016–17.
Housing outcomes
1 in 3
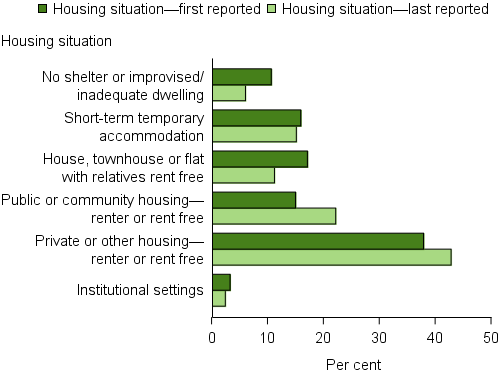
clients (32%, or nearly 57,000) were homeless when support ended, a decrease from 44% at the start of support.
Three aspects of a client's housing situation are considered in their housing circumstances: dwelling type, housing tenure, and the conditions of occupancy. See Technical information for details on these categories and their derivation.
- The reduction in the proportion of clients homeless following support was due to large decreases in both the proportion of clients with either no shelter or living in improvised dwellings (from 11% to 6%) and in the proportion of clients living in a house, townhouse or flat as a 'couch surfer' with no tenure (from 17% to 11%).
- There was also an increase in some forms of tenure over the course of support, including a large increase in the proportion of clients living in public or community housing (from 15% to 22%) (Figure CLIENTS.14).
These trends demonstrate that by the end of support, many clients have achieved or progressed towards more stable housing.
Figure CLIENTS.14: Clients, by housing situation at beginning of support and end of support, 2015–16
Notes
- The SHSC classifies clients living with no shelter or improvised/ inadequate dwelling, short-term temporary accommodation, or in a house, townhouse, or flat with relatives (rent free) as homeless. Clients living in public or community housing (renter or rent free), private or other housing (renter or rent free), or in institutional settings are classified as housed.
- Proportions include only clients with closed support at the end of the reporting period. Per cent calculations are based on total clients, excluding 'Not stated/other'.
Source: Specialist Homelessness Services 2015–16, National Supplementary Table CLIENTS.17.
Other outcomes for clients
1 in 5
clients (20%) who needed employment assistance were employed at the end of support.
Specialist homelessness agencies may support clients in a number of non-housing areas to reduce their vulnerability to homelessness. These include changes in educational enrolment status, labour force status and main source of income.
Education
- For clients whose support had ended, there was little change in the proportion of clients enrolled in education/training, from the beginning to the end of support (approximately 21% at the start and end).
- Among those who also had an identified need for support relating to education or training assistance, 42% were enrolled in education/training at the beginning of support, and this increased to 44% at the end of support.
Employment
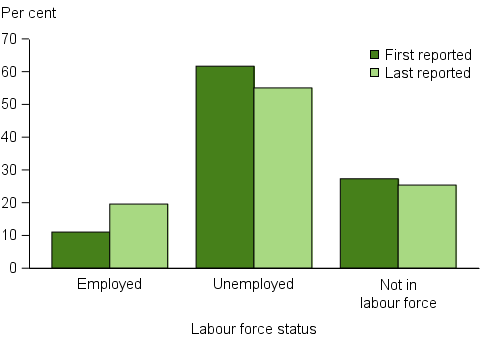
- Figure CLIENTS.15 shows a decrease in the proportion of clients (who had an identified need for employment assistance) who were unemployed following support (55% at the end, down from 62% at the beginning of support).
- Among those clients who had an identified need for employment assistance, the proportion of clients who were employed at the end of their support increased from 11% to 20%.
Figure CLIENTS.15: Clients needing assistance relating to employment, by labour force status at beginning and at end of support, 2015–16
Note: Proportions include only clients with closed support at the end of the reporting period.
Source: Specialist Homelessness Services 2015–16, National Supplementary Table CLIENTS.24.
Income
SHS agencies often provide services to clients aged 15 and over needing assistance to obtain/maintain a government payment or employment assistance.
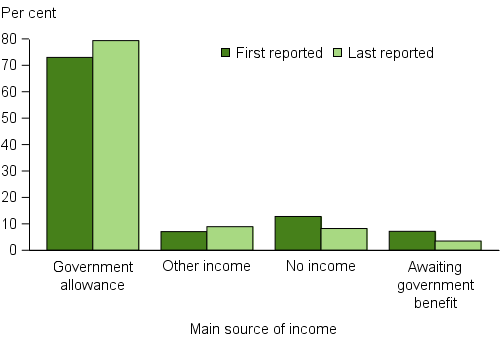
- Of those who needed this type of assistance, the proportion of clients reporting a government payment or allowance as their main income increased from 73% at the start of support to 79% at the end.
- There was a reduction in those reporting that they received no income (from 13% to 8%) and the proportion awaiting government benefits halved (from 7% to 4%) (Figure CLIENTS.16).
Figure CLIENTS.16: Clients needing assistance to secure an income, by main source of income at beginning and end of support, 2015–16
Note: Proportions include only clients with closed support at the end of the reporting period.
Source: Specialist Homelessness Services 2015–16, National Supplementary Table CLIENTS.25.
Achievement of case management goals
Case management plans enable agency workers to assist a client to work towards agreed goals. In some cases, support periods are too short to allow for a case management plan; in other cases, a client may decline a case management plan. Case management approaches can differ across jurisdictions and over time as policy and practices change.
- For those clients with closed support, 61% (or 135,000 clients) had a case management plan—48% in their own right, and 13% were part of another client's case management plan, often as part of a family. The proportion of clients with a case management plan was similar in 2014–15 (60%).
- Among those who had a plan in their own right, 69% achieved some of their case management goals, 23% achieved all their goals and 7% did not achieve any (Supplementary Table CLIENTS.26). The proportion of clients achieving all their goals has decreased slightly when compared to the previous year (26%).
- Of the 39% of clients whose support had ended and who did not have a case management plan, the most common reason given for not having one was that the service episode was too short (70%), while a further 13% did not agree to having a case management plan.
References
- Australian Bureau of Statistics (ABS), 2015a. Australian demographic statistics, Mar 2015. ABS cat no. 3101.0. Canberra: ABS.
- ABS 2015b. Migration, Australia, 2013–14. ABS cat no. 3412.0. Canberra: ABS.