Unmet demand for specialist homelessness services
Specialist homelessness services (SHS) in Australia supported, on average, an estimated 71,000 people each day in 2021–22. However, there were also people who approached agencies who were unable to be offered any assistance (unassisted requests for service) or who did not receive all the services that they required (client’s unmet need for services).
It is important to note that these figures reflect people who approach SHS agencies for support and do not reflect the level unmet demand for support for the whole of the Australian population. Results from the 2014 General Social Survey suggest that of those who had experienced homelessness in the last 10 years, approximately 67% did not seek assistance during their most recent experience of homelessness (ABS 2014).
For those that do approach a SHS agency, there may be a range of reasons an agency cannot provide assistance. For example, the person may be seeking a specialised service not offered by that particular agency, the agency may not have the capacity to provide assistance at that time or the person may not be in the target group for the agency. Research found that in 2019, 76% of staff in housing and homelessness services reported an increase in the number of clients they were unable to support and 36% reported rarely or never being able to meet demand (ACOSS 2019).
Over recent years, changes have been made to services delivery models and these systems often require agency workers to provide assistance of some kind to all presenting individuals. Therefore, caution should be used when comparing SHS data relating to unmet demand and unassisted request over time and between states and territories. See Technical information for more information.
Unassisted requests for services
Key findings – Unassisted requests for services
- In 2021–22, on average, there were nearly 300 unassisted requests per day (UNASSISTED.1); a total of around 105,000 unassisted requests for 2021–22 (HIST.UNASSISTED), which was around 8,900 less than in 2020–21 (114,000).
- Almost two-thirds (63%) unassisted requests involved short-term or emergency accommodation and nearly one-quarter (22%) unassisted requests involved other housing or accommodation (UNASSISTED.4).
- Most commonly, agencies were unable to offer requests for accommodation because there was no accommodation available at the time.
- The majority of unassisted requests were for females (65%) similar to 2020–21 (HIST.UNASSISTED).
Identifying unassisted requests for services in the Specialist Homelessness Services Collection (SHSC)
Unassisted requests for services are instances where a person requests assistance from a SHS agency and receives no assistance at the time of request. The information required for reporting is limited as it is not always appropriate for an agency to collect the same detailed information as they would if the person was to become a client.
The data does not reflect that some people may seek support from multiple different agencies on the same day, or that clients unassisted on one day may receive support another day. Also, some states/territories have central intake models, that is, agencies that link clients to specific services suited to the individual client's needs. This may decrease the number of unassisted requests for services for jurisdictions operating central intake services.
See Technical information for more information on measuring unassisted requests in the SHSC.
Unassisted requests for services 2021–22
Across Australia, there were around 105,000 unassisted requests in 2021–22.
- On average, there were nearly 300 unassisted requests per day (Supplementary table UNASSISTED.1).
- Around two-thirds (66%) of daily unassisted requests were made by females and 34% by males (where both age and sex were known; Supplementary table UNASSISTED.2). Among females, around 23% unassisted requests were from females aged 25–34 whereas for males the most common age group was 0–9 (23%), that is, most likely male children presenting as part of a family group.
- The majority (85%) of unassisted requests from single adults with children were from females (Supplementary table UNASSISTED.7).
Unassisted requests for services, trends over time
Some key trends in unassisted requests over time include:
- The number of unassisted requests decreased from 114,000 requests in 2020–21 to 105,100 in 2021–22 (Historical data table HIST.UNASSISTED). The decrease in unassisted requests was primarily due to decreases in Victoria and Tasmania. For further details, see the Data quality information and Technical notes.
- The proportion of unassisted requests made by people presenting alone increased from 56% in 2018–19 to 59% in 2021–22 while the proportion of unassisted requests from single parents decreased (38% to 34% respectively).
Analysis of how often an unassisted person requested assistance and how many were SHS clients at some point during the 2021–22 year can only be examined and understood where the statistical linkage key (SLK) was complete and valid (around 53% of all unassisted requests).
Of the valid data, in 2021–22 on average each unassisted person approached an agency 1.6 times (Historical data table HIST.UNASSISTED). Around half (48%) of people with a valid SLK were also clients and received services at some point during the year, similar to 2020–21 (47%). The service use experience for the remaining 52% of people with a valid SLK were unknown. They may have received assistance from a non-SHS service, used their own support networks or continued to experience unstable housing or homelessness without SHS support.
Services requested
In 2021–22:
- The majority (63%) of daily unassisted requests involved short-term or emergency accommodation (Supplementary table UNASSISTED.4).
- Unassisted requests for short-term or emergency accommodation were more likely to be made by females than males – on average there were approximately 108 unassisted requests from females for short-term or emergency accommodation per day compared with 59 for males.
- Nearly one-quarter (22%) of daily unassisted requests involved housing or accommodation other than short-term or emergency accommodation.
- Unassisted requests on average most commonly came from people presenting alone (194 instances per day) or single people with children (approximately 56 instances) (Supplementary table UNASSISTED.5).
- When a reason was recorded, most commonly agencies could not meet requests for any accommodation because there was no accommodation available at the time of the request (Supplementary table UNASSISTED.6).
Clients’ unmet need for services
Key findings – Clients’ unmet need for services
- Around 164,400 SHS clients (60%) identified a need for accommodation services in 2021–22 and this service was provided to half of these clients (around 83,200 clients or 51%) (CLIENTS.24).
- The ability of agencies to provide certain specialist services was similar to the previous year. For example, in 2021–22, around 36% of mental health service requests were neither provided nor referred (CLIENTS.24), remaining steady from 2020–21 (36%).
Clients receiving support from SHS agencies often need a wide range of services. Some needs arise more than once in a support period and this makes it difficult to assess the extent to which the need has been met from the available data.
Reporting unmet need for services in the Specialist Homelessness Services Collection (SHSC)
Unmet need is recorded when an SHS client has some, but not all, their identified needs for services met. Agencies can also refer clients to another service for assistance.
Unmet need for accommodation and housing assistance services
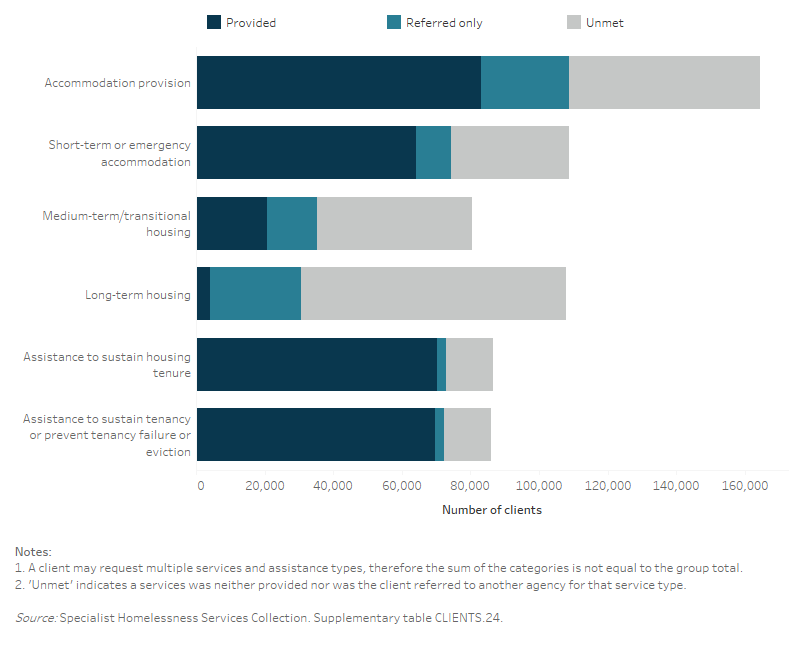
More than half (60%) of all clients needed at least one type of accommodation service (Figure UNMET.1 and Supplementary table CLIENTS.24):
- Around 40% (or 108,800 clients) needed short-term or emergency accommodation; nearly 64,100 (59%) of those requesting this service were provided with assistance.
- Around 107,700 clients (40%) identified a need for long-term housing; about 3.8% (nearly 4,100 clients) of these clients were provided with this type of support.
- The number of clients requesting either short-term or emergency accommodation or long-term housing were similar; however, the proportion of clients who were not provided long-term accommodation was substantial (71% or nearly 77,000 clients) and highlights the complexity of SHS agencies assisting clients to find suitable long-term housing.
Figure UNMET.1: Clients with unmet need for accommodation and housing assistance services, 2021–22
Unmet need for general and specialised services
Agencies were able to meet the general needs of most clients. For example, of the nearly 211,300 clients who needed advice/information, 98% were provided assistance, and of the 145,700 clients requesting advocacy/liaison, 96% were provided with assistance (Supplementary table CLIENTS.24).
Other types of client needs were less commonly met. For example, among SHS clients who required professional legal services (2.8% or nearly 7,700 clients), the level of unmet need (26%) was substantial. This may be because of the specialist skills required to provide legal services and the limited availability of these skills within the SHS agencies and other referral services offered to clients.
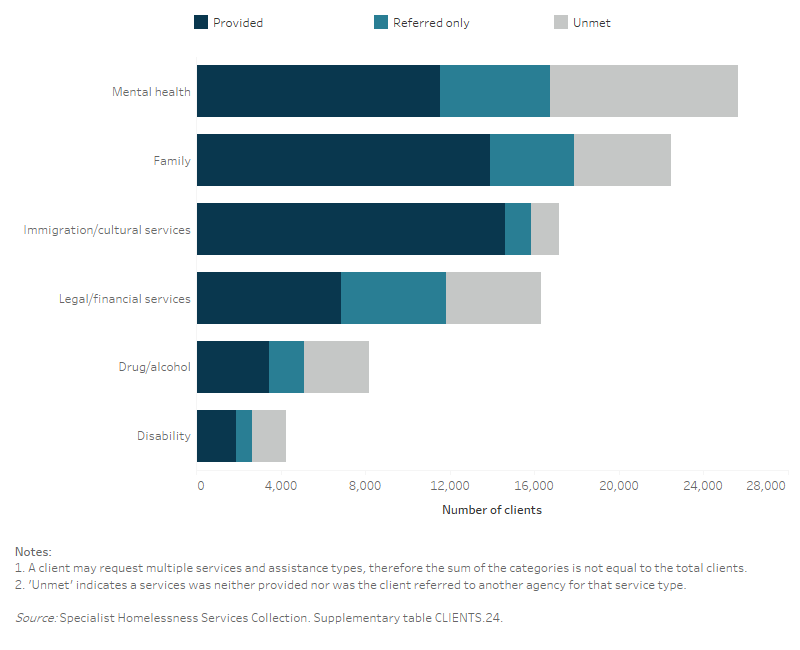
The level of unmet need for broad groups of specialised services can be determined (Figure UNMET.2 and Supplementary table CLIENTS.24):
- Mental health services, including psychological, psychiatric and mental health services, were one of the most common specialised services needed by clients; however, these needs were frequently unmet with 35% neither provided nor referred these services.
- Many of those identifying a need for disability services (1.6% needed this service, 37% not provided or referred) or drug and alcohol services (3.0% needed, 37% not provided or referred) did not have their needs met.
- Immigration and cultural services, needed by 6.3% of SHS clients (nearly 17,200 people), were provided for most requiring them (85%).
Figure UNMET.2: Clients with unmet needs for specialised services (grouped), 2021–22