Cost per NWAU, 2011–12 to 2013-14
For the first time, this report presents the change in the average cost of care for acute admitted patients in Australia’s largest public hospitals across three years.
This report presents findings for major metropolitan public hospitals across Australia. From 2011–12 to 2013–14, on average the expenditure at hospitals to provide acute care increased by 6%. However, this was accompanied by a 5% increase in the number of activity units (NWAUs) for acute admitted patients (Table 1).
This means that the average cost of care (unadjusted for inflation) at major metropolitan public hospitals remained relatively unchanged over this period (1% growth). This growth was slower than inflation (approximately 5%4). This demonstrates that as a group, major metropolitan public hospitals have achieved improvements in efficiency (Table 1).
Across three years, from 2011–12 to 2013–14, eight major metropolitan public hospitals decreased their Cost per NWAU for acute admitted patients by at least 5%. At the same time, six major metropolitan public hospitals increased their Cost per NWAU by at least 10% (Figure 2).
A decrease in Cost per NWAU from 2011–12 to 2013–14 implies an improvement in a hospital’s efficiency. This may be due to initiatives by the hospital, such as a decrease in spending or by increasing the volume of services provided, or a combination of both (Table 3). One way a hospital may ensure more services are provided within its existing expenditure is to treat more patients by decreasing the average length of a patient’s stay in hospital.
Although improvements in data quality may lead to an apparent decrease in a hospital’s Cost per NWAU, state and territory governments have confirmed that the hospitals listed in Table 3 were not affected by changes in data recording practices.
While this report presents results on the efficiency of hospitals, it does not consider other aspects of the quality of care such as access, appropriateness or health outcomes.
| Major metropolitan public hospitals | Reduced spending | Increased number of activity units (NWAUs) |
Reduced spending and increased no. of activity units (NWAUs) |
|---|---|---|---|
| Caboolture Hospital (Qld) | ✔ | ||
| Campbelltown Hospital (NSW) | ✔ | ||
| Mater Adult Hospital (Qld) | ✔ | ||
| Royal Brisbane & Women’s Hospital (Qld) | ✔ | ||
| St George Hospital (NSW) | ✔ | ||
| The Alfred (Vic) | ✔ | ||
| Western Hospital [Footscray] (Vic) | ✔ | ||
| Westmead Hospital (NSW) | ✔ |
Sources:
National Health Performance Authority analysis of results calculated using the National Hospital Cost Data Collection, the Admitted Patient Care National Minimum Data Set and the Hospital Casemix Protocol Data Collection. Data supplied 18 and 28 October 2014 (2011–12 data) and 27 November 2015 (2012–13 and 2013–14 data).
Figure 2: Cost per National Weighted Activity Unit (NWAU)* for acute admitted patients, major metropolitan public hospitals, 2011–12 to 2013–14, sorted by Cost per NWAU in 2013–14
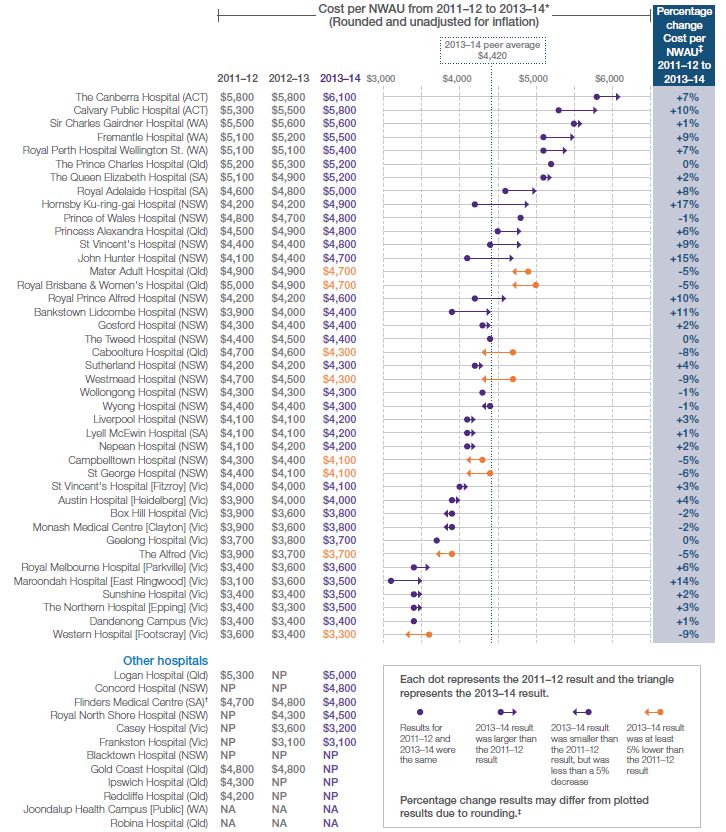
Notes:
* Further information on Cost per NWAU and change over time can be found in the Technical Supplement.
† It is recommended that for this hospital the Cost per NWAU 2011–12 results are not compared to 2012–13 and 2013–14 (see the Technical Supplement).
‡ Percentage change 2011–12 to 2013–14 was calculated on unrounded Cost per NWAU.
NA Data not available at time of publication.
NP Data did not meet minimum reporting requirements as detailed in the Technical Supplement.
Sources:
National Health Performance Authority analysis of results calculated using the National Hospital Cost Data Collection, the Admitted Patient Care National Minimum Data Set and the Hospital Casemix Protocol Data Collection. Data supplied 18 and 28 October 2014 (2011–12 data) and 27 November 2015 (2012–13 and 2013–14 data).