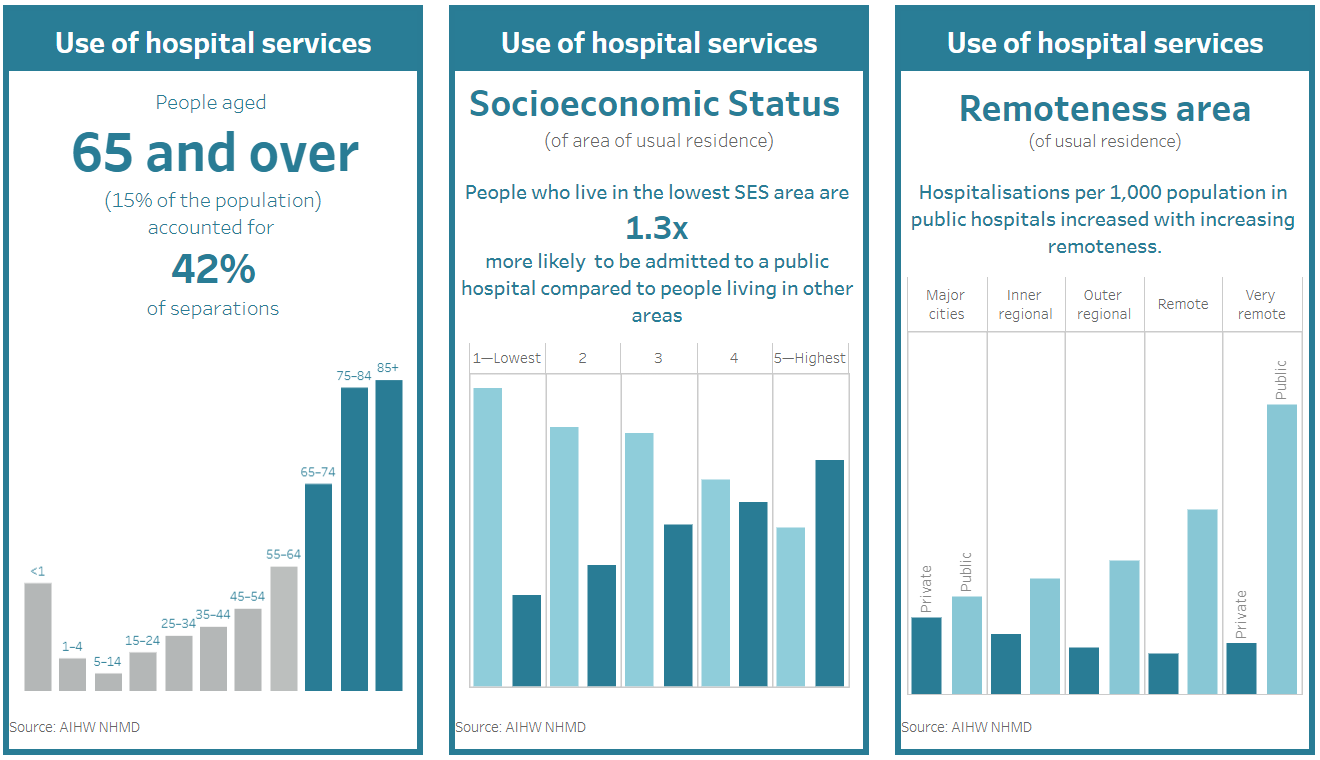
Who used admitted patient care services?
This section presents information that can be used to assess the accessibility of admitted patient services.
Australian Institute of Health and Welfare (2019) Hospitals at a glance 2017–18, AIHW, Australian Government, accessed 26 April 2024.
Australian Institute of Health and Welfare. (2019). Hospitals at a glance 2017–18. Retrieved from https://www.aihw.gov.au/reports/hospitals/hospitals-at-a-glance-2017-18
Hospitals at a glance 2017–18. Australian Institute of Health and Welfare, 23 August 2019, https://www.aihw.gov.au/reports/hospitals/hospitals-at-a-glance-2017-18
Australian Institute of Health and Welfare. Hospitals at a glance 2017–18 [Internet]. Canberra: Australian Institute of Health and Welfare, 2019 [cited 2024 Apr. 26]. Available from: https://www.aihw.gov.au/reports/hospitals/hospitals-at-a-glance-2017-18
Australian Institute of Health and Welfare (AIHW) 2019, Hospitals at a glance 2017–18, viewed 26 April 2024, https://www.aihw.gov.au/reports/hospitals/hospitals-at-a-glance-2017-18
PDF | 3.5Mb
This section presents information that can be used to assess the accessibility of admitted patient services.