Technical notes
2025 NSHS data collection and reporting methodology
Introduction
This appendix provides an overview of the 2025 National Social Housing Survey (NSHS) data collection and reporting methodology. Further information on the 2025 NSHS methodology, including a copy of the final questionnaire, can be found in related materials.
Data collection
The data quality statement for the 2025 NSHS is available online. Key information is as follows.
Survey scope
The 2025 NSHS collected information from tenants of 3 social housing programs – public housing (PH), community housing (CH), and state owned and managed Indigenous housing (SOMIH).
Table Intro.1 provides information on the housing programs covered in each state and territory.
NSW | Vic | Qld | WA | SA | Tas | ACT | NT | |
|---|---|---|---|---|---|---|---|---|
State/territory has Public Housing | Y | Y | Y | Y | Y | Y | Y | Y |
Public Housing in‑scope for 2025 NSHS | Y | Y | Y | Y | Y | Y | Y | Y |
State/territory has SOMIH | Y | N | Y | N | Y | Y | N | Y |
SOMIH in‑scope for 2025 NSHS | Y | . . | Y | . . | Y | Y | . . | N |
State/territory has CH | Y | Y | Y | Y | Y | Y | Y | Y |
Community Housing in‑scope for 2025 NSHS | Y | Y1 | Y | Y | Y | Y | Y | N |
State/territory has Indigenous Community Housing (ICH) | Y | Y | Y | Y | Y | Y | N | Y |
ICH in-scope for 2025 NSHS | N | N | N | N | N | N | . . | N |
Y yes
N no
. . not applicable
- Surveying of Community Housing tenants in Victoria does not include those tenants in Aboriginal Community Controlled Housing Organisations (ACCHOs).
Data collection methodology
Among PH, CH and SOMIH tenants (the latter South Australia and Tasmania only), the 2025 NSHS was conducted via a mail-out paper questionnaire, with an option provided for online completion.
Among SOMIH tenants in New South Wales and Queensland and a small number of SOMIH tenants in Tasmania and Community housing tenants in the ACT, the 2025 NSHS was conducted via face-to-face interview. Where tenants were not at home, a drop-at-home survey pack was left at the property.
The 2025 NSHS used the same survey instrument across all housing programs, with the exception of 5 state-specific questions for Queensland. Before 2010, the survey content differed slightly across programs, reflecting different areas of interest in relation to each program. Since 2012, the adoption of more consistent survey instruments has allowed greater data comparability across social housing programs. See related materials for more information.
Each state and territory provided information for each tenancy and each social housing program to Lonergan Research. To protect tenancy privacy and confidentiality, information was handled in line with relevant legislation. All remoteness areas were included in the sample. For the postal component of the survey, various factors (see Survey and interview response rates) may have affected the number of responses received from tenants in these areas.
Sample design
Consistent with 2023, stratified sampling was undertaken to reduce sampling error and to maximise the chance that state and territory/ program sample targets were met. Minimum sample quotas were again employed for remoteness-based strata. For New South Wales, additional stratification was undertaken based on Department of Communities and Justice districts. Quotas were set for each jurisdiction/housing strata, as shown in Table A1. The actual responses received are shown in Table A2.
Jurisdiction | PH | SOMIH | CH |
|---|---|---|---|
NSW | 500 | 500 | 540 |
Vic | 500 | . . | 350 |
Qld | 1,000 | 500 | 500 |
WA | 500 | . . | 350 |
SA | 550 | 300 | 700 |
Tas | 400 | 200 | 400 |
ACT | 500 | . . | 200 |
NT | 500 | n.a. | n.a. |
. . Not applicable (state or territory does not have the program)
n.a. Not available (state or territory not in scope for the 2025 NSHS in the program)
Survey and interview response rates
The response rate for the mail-out/online component of the 2025 NSHS was 26%; for face-to-face interviews, it was 45%. Some non-response bias is expected. The Sample alignment with administrative data section examines key differences between the sample population and the actual social housing tenant population – therefore providing some indication of the potential for non-response bias. Apart from sample weighting (see Weighting following this section), no adjustments have been made for non-response bias.
Changes to the management of tenant privacy has meant that Lonergan Research was unable to be provided with personal information for most tenants since 2021. Letters were instead addressed ‘to the tenant’, which impacted on response rates, partly because individuals are more likely to open mail that is addressed to them personally. Where no personal information was provided, tenants could not be sent digital reminders which also contributed to a drop in response rates.
Response rates by housing program and state and territory are provided in Table A2.
Program | NSW | Vic | Qld | WA | SA | Tas | ACT | NT |
|---|---|---|---|---|---|---|---|---|
Public housing Responses (no.) | 789 | 620 | 1,140 | 501 | 648 | 478 | 526 | 563 |
Public housing Response rate | 28 | 25 | 25 | 25 | 40 | 30 | 32 | 17 |
Community housing Responses (no.) | 696 | 402 | 517 | 404 | 847 | 474 | 124 | n.a. |
Community housing Response rate | 25 | 25 | 23 | 26 | 31 | 26 | 16 | n.a. |
SOMIH Responses (no.) | 507 | . . | 505 | . . | 191 | 49 | . . | n.a. |
SOMIH Response rate | 41 | . . | 49 | . . | 16 | 30 | . . | n.a. |
Notes
- For the mail-out/online component, the response rate was calculated as the number of completed surveys returned as a percentage of the total tenants mailed (excluding any that were returned to sender). For face-to-face surveys, the response rate was calculated as the number of completed interviews as a percentage of the total number of interviews attempted.
- SOMIH tenants were surveyed via face-to-face interviews in New South Wales and Queensland. South Australia and Tasmania SOMIH tenants were surveyed via mail out. Response rates between the 2 methodologies are not directly comparable
Weighting
Consistent with the 2023 NSHS, a grouped weighting methodology was employed. Population groups were created across 3 variables: housing type, state and territory, and remoteness. The weighting was calculated as follows: the number of households in each population group divided by the number of usable survey responses. All population counts were confirmed by the states and territories.
Sampling error
The estimates are subject to sampling error. Relative standard errors (RSEs) are calculated for findings from the 2025 NSHS to help the reader assess the reliability of the estimates. Only estimates with RSEs of less than 25% are considered sufficiently reliable for most purposes. Results subject to RSEs of between 25% and 50% are marked as such and should be interpreted with caution. Those with RSEs greater than 50% are considered too unreliable and are not published. To help interpret the results further, 95% confidence intervals (the estimate plus or minus 1.96 standard errors) are available online as supplementary tables to the 2025 NSHS.
Non-sampling error
The estimates are subject to both sampling and non-sampling errors. The survey findings are based on self-reported data. Non-sampling errors can arise from errors in reporting of responses (for example, failure of respondents’ memories or incorrect completion of the survey form), or the unwillingness of respondents to reveal their true responses. Further non-sampling errors can arise from coverage or interviewer or processing errors. It is also expected that there is some level of non-response error where there are differing levels of non-response from certain subpopulations.
Comparability with previous NSHSs
Surveys in this series began in 2001. Over time, the survey’s methodology and questionnaire design have been modified. The sample design and the questionnaire of the 2025 survey differ in some minor respects from previous versions of the survey. Further details are available in related materials.
The previous NSHS was undertaken in 2023 and while the NSHS is ordinarily undertaken every 2 years, the 2020 survey was delayed due to the COVID-19 pandemic. ICH tenants in Queensland were featured in the 2018 and 2023 samples, noting that due to the COVID-19 pandemic, ICH was not collected for the 2021 wave. For the 2025 wave, the survey scope was defined by three primary national housing programs: Public Housing; SOMIH; and Community Housing.
The revisions of the survey undertaken for the 2021 NSHS were the most substantial since 2012. These revisions included some restructuring of sections, changes to question wording, the addition of COVID‑19 pandemic-related questions and new state-specific questions (for South Australia PH/SOMIH and the Australian Capital Territory PH). For 2023, the COVID-19 pandemic-related questions were removed and replaced with questions relating to neighbours and wellbeing.
The 2025 NSHS sampling and stratification methods were similar to those for the 2023 survey: a sample was randomly selected from each stratum. Some additional location-based stratification was undertaken for New South Wales in 2021, 2023 and 2025.
Caution should be used when comparing NSHS trend data or data between states and territories due to differences in response rates and non-sampling errors. Some substantial decreases in response rates for mail-out surveys were observed in 2021 and response rates were largely stable between 2023 and 2025.
As in 2016, 2018, 2021 and 2023, the data collected for SOMIH was sourced using 2 methodologies: via mail-out and via face-to-face interview. Since 2016, the mail-out approach was used for SOMIH tenants in South Australia and Tasmania and the face-to-face approach was used for SOMIH tenants in New South Wales and Queensland. In 2021 the approach in Queensland for these tenants changed from face-to-face (used in 2016 and 2018) to mail-out due to COVID-19 pandemic restrictions. This reverted back to face-to-face in 2023. In 2025, face-to-face interviews were also conducted for a small number of SOMIH tenants in Tasmania. Different methodologies not only influence the overall response rate, but also have potential impacts on the completion of each question and how tenants perceived and responded to questions. Trend data from before 2016 (and also in 2016 and 2018 for Queensland) and comparisons between states and territories, should therefore be interpreted with caution.
Refer to data quality statements for the 2014 NSHS, 2016 NSHS, 2018 NSHS, 2021 NSHS, 2023 NSHS and 2025 NSHS and their accompanying technical reports before comparing data across surveys.
Reporting methodology – respondents versus households
Responses to the NSHS can report information:
- about the social housing tenant completing the survey (the respondent), such as age and gender
- that refers to themselves and other individuals in the social housing household, such as whether there are any adults in the household currently working full time
- on behalf of all members of their household, such as whether the location of their dwellings meet the needs of the household.
In each instance, this is noted under the relevant chart or table throughout the report.
It is important to distinguish between household-level responses and responses to those questions that specifically target the individual who completed the survey. Responses related to the individual completing the survey may not apply to other members of the household.
It should also be noted that, where survey respondents have provided information on behalf of other household members, they have not been asked if they had consulted members in formulating their responses.
Missing data
Some survey respondents did not answer all questions, either because they were unable or unwilling to provide a response. The survey responses for these people were retained in the sample, and the corresponding values were set to missing. Cleaning rules resulted in the imputation of responses for some missing values. Missing responses were excluded from the numerator and denominator of estimates presented in this report.
Sample alignment with administrative data
As part of the NSHS, tenants who responded to the survey were asked to report the gender and age of all members of their household; they were also asked questions to establish if anyone in the household was of Aboriginal or Torres Strait Islander origin or had a need for assistance due to disability. Table B1 compares the age and gender distribution of all 2025 NSHS household members with similar information from administrative data collections. The distribution of 2025 NSHS households across selected household-level characteristics is also compared with corresponding information from administrative data collections.
For this analysis, the 2025 NSHS data were weighted. Weighting helps account for over- or under-representation of particular groups of tenants in the responding sample, to the extent that these differences reflect differences across states and territories by remoteness and housing program categories (these are the groups, or strata, used to determine weights for sample responses).
As Table B1 shows, the 2025 NSHS and administrative data were broadly aligned. The largest differences were observed for household composition and disability status, particularly among SOMIH households. This may be partly due to the much smaller size of that program, so that relatively small differences in numbers would lead to greater differences in proportions.
Within PH and CH, tenants aged 5–17 appeared to be under-represented in the NSHS, compared with administrative data, while the profile of NSHS SOMIH tenants was slightly younger than in the administrative data. SOMIH was conducted via face-to-face interviews in New South Wales and Queensland which contributed more than one-third of the total SOMIH sample. Face-to-face interviews were also conducted for a small number of SOMIH tenants in Tasmania in 2025. It may be that the different collection methodologies resulted in different non-response biases.
One characteristic recording a noticeable difference between 2025 NSHS results and the corresponding information drawn from administrative data is household composition. For all programs, the proportion of sole parents with children was markedly higher in the NSHS than in the administrative data collections, and the proportion of group or mixed composition households was lower in the NSHS.
While most of the NSHS analysis in this report drew on information about the entire time a tenant had been living in social housing, in Table B1, NSHS information about time in the current home was used, as that information would more closely compare with information about tenure length from administrative data collections. Even so, it appeared that households who had been in social housing for longer than 20 years were over-represented in the NSHS, particularly among SOMIH tenants.
Finally, there were some discrepancies between the NSHS and administrative data in the proportions of Indigenous households, and households where there was one or more household member with disability.
Gender (all occupants) | PH NSHS 2025 | PH Admin. data | SOMIH NSHS 2025 | SOMIH Admin. data | CH NSHS 2025 | CH Admin. data |
|---|---|---|---|---|---|---|
Males | 37 | 44 | 44 | 45 | 35 | 56 |
Females | 47 | 56 | 55 | 55 | 51 | 43 |
Other/not stated | 16 | 1 | 1 | 0 | 14 | 2 |
Age (years) (all occupants) | PH NSHS 2025 | PH Admin. data | SOMIH NSHS 2025 | SOMIH Admin. data | CH NSHS 2025 | CH Admin. data |
|---|---|---|---|---|---|---|
Under 5 | 4 | 4 | 8 | 5 | 3 | 5 |
5 to 17 | 14 | 21 | 31 | 31 | 12 | 19 |
18 to 24 | 6 | 8 | 10 | 12 | 7 | 8 |
25 and over | 68 | 68 | 50 | 52 | 70 | 67 |
Not stated | 8 | 0 | 1 | 0 | 8 | 1 |
Household composition | PH NSHS 2025 | PH Admin. data | SOMIH NSHS 2025 | SOMIH Admin. data | CH NSHS 2025 | CH Admin. data |
|---|---|---|---|---|---|---|
Single adult | 56 | 58 | 22 | 21 | 63 | 64 |
Couple only | 9 | 5 | 4 | 3 | 9 | 5 |
Sole parent with dependent children | 16 | 13 | 38 | 29 | 15 | 12 |
Couple with dependent children | 5 | 2 | 10 | 7 | 3 | 2 |
Group and mixed composition | 4 | 18 | 24 | 40 | 4 | 16 |
Not stated | 9 | 5 | 3 | 0 | 7 | 1 |
Tenure length (years) | PH NSHS 2025 | PH Admin. data | SOMIH NSHS 2025 | SOMIH Admin. data | CH NSHS 2025 | CH Admin. data |
|---|---|---|---|---|---|---|
2 years or less | 14 | 14 | 16 | 14 | 23 | n.a. |
Over 2 to 5 years | 14 | 17 | 17 | 21 | 21 | n.a. |
Over 5 to 10 years | 18 | 20 | 18 | 23 | 19 | n.a. |
Over 10 to 15 years | 12 | 12 | 12 | 18 | 14 | n.a. |
Over 15 to 20 years | 9 | 10 | 8 | 6 | 6 | n.a. |
Over 20 years | 26 | 19 | 28 | 10 | 13 | n.a. |
Not stated | 4 | 7 | 1 | 8 | 3 |
First Nations household status | PH NSHS 2025 | PH Admin. data | SOMIH NSHS 2025 | SOMIH Admin. data | CH NSHS 2025 | CH Admin. data |
|---|---|---|---|---|---|---|
First Nations household | 12 | 14 | 97 | 100 | 12 | 12 |
Non-Indigenous household | 84 | 66 | 3 | 0 | 84 | 84 |
Not determined | 4 | 20 | 0 | 1 | 4 | 4 |
Household disability status | PH NSHS 2025 | PH Admin. data | SOMIH NSHS 2025 | SOMIH Admin. data | CH NSHS 2025 | CH Admin. data |
|---|---|---|---|---|---|---|
Person(s) in household with disability | 29 | 40 | 20 | 20 | 27 | 32 |
No person in household with disability | 70 | 50 | 80 | 44 | 71 | 63 |
Not determined | 2 | 11 | 0 | 36 | 2 | 5 |
Note:
- Components within each characteristic may not add to 100% because of rounding. Sources: AIHW National Housing Assistance Data Repository; NSHS 2025.
Regression analysis – details
Regression analysis of NSHS data examines the statistical relationships between multiple explanatory factors and tenant satisfaction. This type of statistical technique shows which individual factors are significantly associated with tenant satisfaction, after simultaneously accounting for the confounding effects of the other factors included in the model (see, for example, Schonlau 2023; Sperandei 2014).
In particular, regression analysis was used to help answer the following key questions:
- What are the most important factors associated with tenant satisfaction, after accounting for differences in geography, demographic and housing-related factors?
- Do the factors associated with satisfaction differ depending on the type of housing program?
- How do we account for apparent differences in satisfaction between different populations? What factors best explain the observed differences?
This appendix provides a detailed description of the regression analysis method and results.
Method
Logistic regression was the statistical technique used for this analysis. Logistic regression is an appropriate analytical technique to use when the outcome variable has 2 categories. In the analysis used for this report, the outcome variable had 2 categories: whether the social housing tenant was satisfied (satisfied or very satisfied) or not satisfied (neither satisfied nor dissatisfied, dissatisfied or very dissatisfied) with the services provided by their housing organisation.
A regression model was developed that included variables available in the NSHS data set (referred to as factors in this report) that had been identified in previous analyses as being potentially related to tenant satisfaction, along with key geographic, psychosocial and sociodemographic factors (Table C1). This model (Model 1) was used to analyse all social housing tenants in the 3 main programs combined – PH, CH and SOMIH. Similar models were used to analyse tenants within each program – (Models 2–4). The only differences in Models 2–4 compared with Model 1 were:
- Models 2–4 did not include housing program as a variable, as each was single-program only.
- Model 3 (SOMIH) did not include the variable Whether First Nations household as the SOMIH program is specifically targeted at First Nations households.
More information about the variables used in the analysis is provided in Table C1. To have a point of reference, so that the direction and size of a factor’s relationship with satisfaction can be seen, a base case (reference category) is assigned for each variable in the model (for example, for the variable housing program, the base case is PH). The reference group is a hypothetical group of tenants with all the base case characteristics combined.
Base cases for each variable were selected because they provide a useful point of reference – for example, they were the bottom or top of a variable range (for example, , employed); they represented the most common group (for example, PH, major cities, Non-Indigenous households, households without disability, no structural problems, 7 working facilities, ‘adequate’ home utilisation, house as the previous dwelling type, no experience of homelessness in the last 5 years, very comfortable asking neighbour for help, safety/security needs of home are met; safety/security needs within neighbourhood are met; thermal comfort needs are met; energy efficiency needs are met; no experience of struggling to pay rent or bills, no experience of high level of loneliness or isolation); or they represent a benchmark for tenant satisfaction (for example, living in social housing for 0–5 years).
The logistic regression analyses were conducted in R using the ‘svyglm’ function to incorporate survey design and weights. The survey weight was included in these analyses to partly account for over- or under-representation (by housing program, state/territory and remoteness and program type) of particular groups of tenants in the responding sample.
Variable/category | Variable construction |
|---|---|
Outcome variable: | Outcome variable construction: |
Tenant satisfaction Satisfied Not satisfied | Observations with invalid or missing responses were excluded from the analysis. Satisfied = Very satisfied or satisfied Not satisfied = Neither satisfied nor dissatisfied, Dissatisfied, Very dissatisfied |
Explanatory variables: | Explanatory variables construction: |
State/territory NSW, Vic, Qld (base case), WA, SA, Tas, ACT, NT | As recorded. No missing or invalid responses. |
Remoteness Major cities (base case), Inner regional, Outer regional, and Remote/very remote | Categories ‘Remote’ and ‘Very remote’ were combined. No missing or invalid responses. |
Employment status Employed (base case) Not employed | Observations with invalid or missing responses were excluded from the analysis. |
Whether First Nations household (this factor not in SOMIH model) First Nations household Household not Indigenous (base case) | Observations with invalid or missing responses for any of the relevant questions were excluded from the analysis. Classified as First Nations if tenant identified that they or another member of their household were Aboriginal or Torres Strait Islander. Classified as non-Indigenous if tenant (a) did not identify any member of their household (including themselves) as Aboriginal or Torres Strait Islander and (b) identified that they (and any other members of the household) were not Indigenous. |
Whether person with disability in household One or more persons with disability in household, other households (base case) | Observations with invalid or missing responses for the relevant questions were excluded from the analysis. Classified as at least one person with disability in household if tenant identified that they or another member of their household had difficulties seeing, hearing, walking or climbing stairs, remembering or concentrating, self-care or communicating using usual language due to a long-term physical, mental or emotional health condition. Else classified as no household members with disability. |
Housing program Public housing (base case), community housing, state owned and managed Indigenous housing | As recorded by fieldwork provider No missing or invalid responses. |
Number of structural problems 0 (base case), 1, 2, 3+ | Observations with invalid or missing responses were excluded from the analysis. |
Number of working facilities 0–6, all 7 nominated (base case) | Observations with invalid or missing responses were excluded from the analysis. |
Housing utilisation Overcrowded, Adequate (base case), Underutilised | Observations with invalid or missing responses to the relevant questions were excluded from the analysis. Refer to Canadian National Occupancy Standard definition in Glossary. |
Time living in social housing (years) 0–5 (base case), 6–10, 11–15, 16+ | Observations with invalid or missing responses were excluded from the analysis. Categories ‘Less than a year’, ‘1–2 years’ and ‘3–5 years’ were combined, categories ’16–20’ and ’21 or more’ were combined. |
Previous dwelling type House/ townhouse/ flat (base case), Other than a house/ townhouse/ flat | Observations with invalid or missing responses were excluded from the analysis. All categories other than ‘House/townhouse/flat’ were combined into a single category, comprising caravan/cabin/boat/mobile home, no dwelling/improvised dwelling/motor vehicle/tent, and temporary accommodation/institution/other. |
Previous homelessness Had not experienced homelessness in the last 5 years (base case), Had experienced homelessness in the last 5 years | Observations with invalid or missing responses were excluded from the analysis. Classified as having experienced homelessness in the last 5 years. |
Neighbours Very comfortable asking for help (base case), comfortable, neither comfortable nor uncomfortable, uncomfortable or very uncomfortable | Observations with invalid or missing responses were excluded from the analysis. Uncomfortable and very uncomfortable combined. |
Amenity needs Safety/security needs of home are met (base case); Safety/security needs of home are not met. Safety/security needs within neighbourhood are met (base case); Safety/security needs within neighbourhood are not met. Thermal comfort needs are met (base case); Thermal comfort needs are not met. Energy efficiency needs are met (base case); Energy efficiency needs are not met. | Observations with invalid or missing responses were excluded from the analysis. |
Wellbeing Had not experienced struggling to pay rent or bills (base case), Had experienced struggling to pay rent or bills; Had not experienced high level of loneliness or isolation (base case), Had experienced high level of loneliness or isolation. | Observations with invalid or missing responses were excluded from the analysis. |
Results
The results from the regression analysis are in the form of predicted probabilities. These are the likelihood, estimated by the models, of a tenant’s reporting that they are satisfied given they hold a particular set of characteristics (a category for each of the factors included in the model). This can be compared with the predicted probability for the reference group, who hold all the base case characteristics. A higher probability for a particular category (say, the category community housing for the factor housing program), when compared with the reference group, indicates that the category of interest (in the example just given, CH) is positively associated with tenant satisfaction in comparison to the base case (for housing program the base case is PH). A negative difference between the category of interest and the reference group indicates a negative association (for example, SOMIH versus the base case of PH).
The predicted probability (expressed as a percentage) was derived from the R ‘svyglm’ outputs, which were in the form of odds and odds ratios. This was done as follows (see ABS 2012; Eckel 2008):
Step 1. The predicted probability for the reference group was calculated. The log-odds for the reference group is reported in the R output as the model intercept. To convert this to a predicted probability, the log-odds was converted to odds by exponentiating the log-odds. The odds was then converted to a predicted probability using the formula: 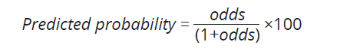
Step 2. The odds ratio (exponentiating the model coefficients of the R output) for each factor category was applied to the reference group odds (obtained from Step 1) to obtain the odds for that factor category (with all other factors having the reference category values). This was then converted to a predicted probability using the formula provided in Step 1.
Step 3. The difference between the predicted probability for the factor category and the reference group was obtained
Table C2 shows the predicted probability of the reference group for each model, and the number of observations for each.
Identifying key factors in tenant satisfaction using logistic regression analysis
Logistic regression analysis is a way to examine relationships between multiple factors (for example, social housing program, location and condition) with an outcome (such as tenant satisfaction). This statistical technique shows which individual factors are significantly associated with tenant satisfaction, after accounting for other factors included in the model (see, for example, Schonlau 2023; Sperandei 2014); or in other words, when all else is equal between tenants. Using NSHS data, a regression model for tenant satisfaction (illustrated below) was developed to include housing-related, geographic, psychosocial and sociodemographic factors.
Figure Model.1: Factors that may contribute towards tenant satisfaction
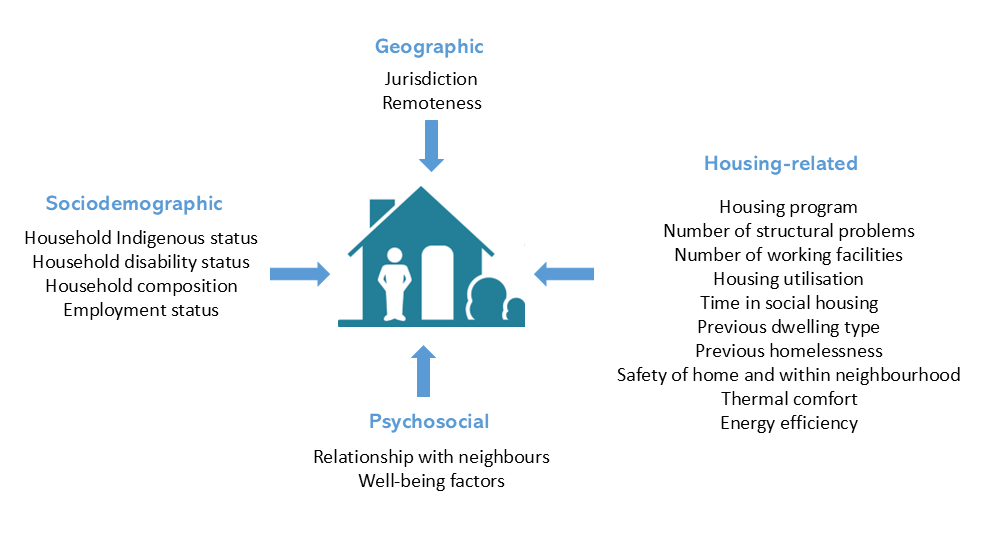
The regression model is used to explore how likely it is that a tenant with a particular set of characteristics would be satisfied with their housing services. The value of the technique is that it allows comparisons of the ‘predicted probabilities’ for 2 tenant groups that differ by a single characteristic, when all else is equal (or held constant). If the model identifies a statistically significant difference, this suggests there could be a relationship between the factor in question and tenant satisfaction – a relationship that holds after accounting for all factors included in the model.
To create a point of reference, a base case is assigned for each variable in the model so that the direction and size of a factor’s relationship with satisfaction can be seen. See Table C1 for the categories and base cases for all factors in the model. The reference group is a hypothetical group of tenants with all the base case characteristics combined. This provides a point of reference only and does not affect the findings. All estimates (such as predicted probabilities) presented in this report are in reference to the base case. See the technical notes for a detailed description of the base case.
The base case for each variable were chosen because they provide a useful point of reference. For example, they were the bottom or top of a variable range (for example, time in social housing); they represented the most common group (for example, public housing); or they appear to have higher satisfaction levels (for example, very comfortable asking neighbour for help).
This report presents the predicted probability of satisfaction for tenants in the reference group and shows how predicted satisfaction changes for tenants who differ on just one characteristic. For example, in the section on dwelling condition, the likelihood of being satisfied for tenants with structural problems is compared with those with no structural problems (the base case), while accounting for other factors. Predicted probabilities are presented as percentages but differ from the descriptive proportions included elsewhere in this report.
The technical notes present detailed information about the regression method and results.
M1 – All tenants | M2 – PH only | M3 – SOMIH | M4 – CH | |
|---|---|---|---|---|
Predicted probability of reference group (%) | 96 | 95 | 98 | 96 |
Number of observations | 7300 | 3670 | 1159 | 2473 |
Note: See Table C1 for the base case for each variable in the models – these are the characteristics of the reference groups
Factor by factor, the regression results presented in Table R.3 show:
- The predicted probability of satisfaction for a tenant with the characteristics of the reference group (the base case categories combined), except in the factor of interest (category as shown).
- The value of model estimates – this indicates the level of confidence we can have in there being a relationship between a factor category and the outcome (satisfaction). A typical convention is to describe p values of less than 0.05 as being statistically significant (with a 95% level of confidence). However, there may be results that do not meet this standard but are still of importance or interest (perhaps they complement/align with other findings, or the magnitude of the association is large). Conversely, not all differences with a p value < 0.05 are necessarily important or noteworthy, especially if the effect is small.
An example will illustrate how to use the results from Table R.3 by examining the factor structural problems using Model 1 (M1). The preceding table (Table C2) shows the predicted probability of being satisfied for the reference group in M1 is 96%. The base case for the factor structural problems is 0 structural problems in the home. The results presented in Table R3 for the categories 1 structural problem through to 3 or more structural problems allow us to see the predicted change in satisfaction when comparing tenants with no structural problems to tenants with one or more, while holding all other factors constant. The predicted probability in M1 of being satisfied for tenants living with 3 or more structural problems is 87%. This is substantially lower than the probability of being satisfied for the reference group (96%), with a category of 0 structural problems. Not only is the effect large, it is also statistically significant (p<0.0001).
Abbreviations and symbols
Term | Meaning |
|---|---|
AIHW | Australian Institute of Health and Welfare |
CNOS | Canadian National Occupancy Standard |
CH | community housing |
CI | confidence interval |
ICH | Indigenous community housing |
NSHS | National Social Housing Survey |
PH | public housing |
RSE | relative standard error |
SOMIH | state owned and managed Indigenous housing |
Symbol | Meaning |
|---|---|
. . | not applicable |
n.a. | not available |
n.p. | not published because of small numbers, confidentiality or other concerns about the quality of the data |