Illicit use of drugs
Illicit use of drugs, also referred to here as 'illicit drug use', includes use of illegal drugs, non-medical use of pharmaceutical drugs (an illicit behaviour), and inappropriate use of other substances (such as inhalants).
Current use and trends
The number of people aged 14 or older illicitly using drugs in Australia is increasing
In 2016, about 8.5 million (or 43%) people in Australia aged 14 or older had used an illicit drug in their lifetime (including misuse of pharmaceuticals) (Table 24). Around 3.1 million (or 15.6%) had illicitly used in the last 12 months and 2.5 million (12.6%) had used an illegal drug not including pharmaceuticals (Table 25).
Although the proportion using any illicit drug did not significantly increase from 2013 to 2016, there has been a gradual increase in use since 2007 (from 13.4% to 15.6%) and the number of people illicitly using drugs has increased from about 2.3 million to 3.1 million.
Use of most illegal drugs remained stable and some drugs decreased over the last 3 years
Significant declines were seen in the recent use of meth/amphetamines (from 2.1% to 1.4%), hallucinogens (1.3% to 1.0%), and synthetic cannabinoids (1.2% to 0.3%) from 2013 to 2016 (Figure 11 and Table 24). Use of other drugs surveyed remained relatively stable between 2013 and 2016 but use of some drugs has been gradually increasing over the longer term.
Recent cocaine use has been increasing since 2004 (Table 25). Although the increase between 2013 and 2016 was not significant (from 2.1% to 2.5%); it was however significantly higher than the proportion reported in 2004 (1.0%). Cocaine is now the second most commonly used illegal drug in the last 12 months after cannabis.
Figure 11: Recent use(a) of selected illicit drugs by people aged 14 and over, 2001 to 2016 (per cent)
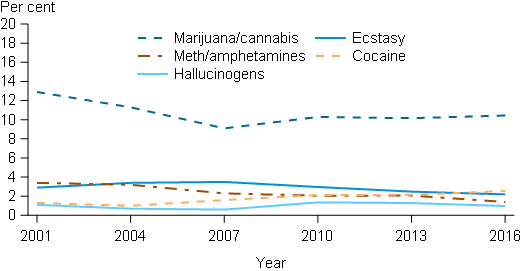
a. Used in the last 12 months.
Source: National Drug Strategy Household Survey (NDSHS) 2016 preliminary findings (Data tables).
Some age groups reported increases in recent use of an illicit drug
Overall, there was no significant change in use of any illicit drug but changes were evident among certain age groups.
- More people in their 40s used illicit drugs in 2016 than in 2013 (increased significantly from 13.6% to 16.2%), particularly among males in their 40s (increased from 15.4% to 20%) (Table 26).
- Females aged 18 or older reported a significant increase in recent use of any illicit drug between 2013 and 2016 (from 12.1% to 13.2%), mainly driven by an increase among females in their 30s (from 12.1% to 16.1%). Females in their 30s were significantly more likely to have recently used cannabis, ecstasy and cocaine in 2016 than in 2013 (Tables 28, 29 and 31).
- Generally, people under 40 have reported a decrease in recent illicit drug usage since 2001, while people 40 or older have reported an increase, particularly in recent years. The largest per cent change was among people aged 60 or older (recent use of any illicit drug increased from 3.9% in 2001 to 6.9% in 2016) followed by people in their 50s (from 6.7% to 11.7%). People aged 60 or older were mainly misusing pharmaceuticals (4.5% in 2016) and people in their 50s were mainly using cannabis (7.2% in 2016).
- People in their 40s in 2016 were more likely to have recently used cannabis, meth/amphetamines and cocaine than people in their 40s in 2001. While people aged 14–19 in 2016 were less likely to have used cannabis, ecstasy and meth/amphetamines than 14–19 year olds in 2001 (Figure 12).
Figure 12: Recent use(a) of selected illicit drugs, by age, 2001 to 2016 (per cent)
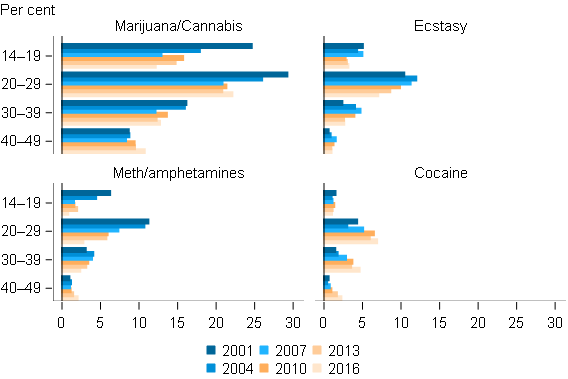
a. Used in the last 12 months.
Note: Apart from cannabis, recent use of illegal drugs was low among people aged 50 or older (<0.4% had used ecstasy, meth/amphetamines or cocaine in the previous 12 months).
Source: NDSHS 2016 preliminary findings (Data tables).
People are trying illicit drugs at an older age
The average age at which people first tried any illicit drug increased, from 19.3 years in 2013 to 19.7 years in 2016 (Table 27). Between 2013 and 2016, older average ages of first use were reported for cannabis (from 18.5 to 18.7 years), meth/amphetamines (from 21.6 to 22.1 years) and hallucinogens (from 20.0 to 20.4 years).
Meth/amphetamine trends
Crystal (or ice) meth/amphetamines continued to be the preferred form of meth/amphetamines used in 2016. Just over 6 in 10 (62%) recent users had used crystal/ice in the previous 12 months and 57% of recent users said that this was their main form of meth/amphetamines used in the previous 12 months (slight but non-significant increase from 50% in 2013) (Table 32). Powder as the main form of meth/amphetamines used continued to decline (significant decrease from 29% in 2013 to 20% in 2016).
It is possible to estimate the proportion of the total population using crystal/ice between 2007 and 2016 by examining the proportion of recent meth/amphetamines users by the main form used in the last 12 months (Figure 13). However, this is likely to be an underestimate as it only accounts for those people who reported that they used crystal/ice as their main form in the previous 12 months. Figure 13 shows that while overall recent meth/amphetamine use declined between 2013 and 2016, the proportion using crystal/ice remained relatively stable between 2013 and 2016 (1% and 0.8% respectively) but has increased since 2010 (0.4%). Use of forms other than crystal/ice has fallen since 2007 and significantly declined between 2013 and 2016 (from 1% to 0.6%).
There were more meth/amphetamines users reporting that they used prescription amphetamines for non-medical purposes in 2016 than in 2013 (Table 32)—the proportion using prescription amphetamines for non-medical purposes in their lifetime and as the main form used in the last 12 months both significantly increased between 2013 and 2016 (from 14.1% to 28% and from 3% to 11.1% respectively).
Figure 13: Recent meth/amphetamine user by main form used in last 12 months, people aged 14 and over, 2007 to 2016 (per cent)
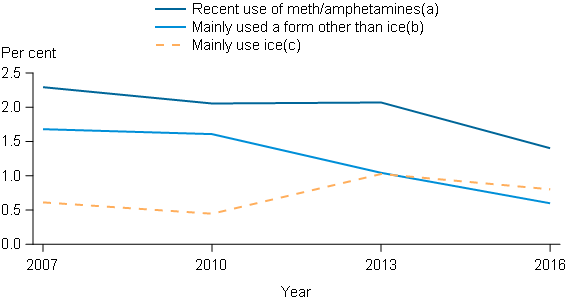
- Used meth/amphetamines in the last 12 months.
- Recent meth/amphetamine users reporting that the main form used in last 12 months was crystal.
- Recent meth/amphetamine users reporting that the main form used in last 12 months was a form other than crystal.
Note: Proportion mainly use ice or a form other than ice was calculated by distributing those meth/amphetamine users who did not answer the 'main form' question proportionally between the responses.
Source: NDSHS 2016 preliminary findings (Data tables).
Use of meth/amphetamines is more frequent among those who mainly use ice
Meth/amphetamine users who mainly used crystal/ice were far more likely to use this drug on a regular basis (32% using it at least weekly) than those who mainly used power (only 5.6% of this group use powder each week; this estimate has a high relative standard error and should be interpreted with caution) (Table 34). There was also a non-significant increase in recent meth/amphetamine users using crystal weekly or more often between 2013 and 2016 (from 25% to 32%).
Frequency of use
While cocaine and ecstasy were used by more people than methamphetamines in the previous 12 months, they were used much less frequently. For example, in 2016:
- The majority of people using cocaine and ecstasy only used it once or twice a year (64% and 51% respectively) and only 2–3% use it at least once a week (Table 35).
- Cannabis and meth/amphetamine users were much more likely to use the drug on a regular basis with 36% and 20% (respectively) using it as often as weekly.
Pharmaceutical misuse
In the context of illicit drug use, a pharmaceutical is ‘a drug that is available from a pharmacy, over-the-counter or by prescription, which may be subject to misuse’ (MCDS 2011). Misuse includes use for non-medical purposes or in doses or frequencies other than those prescribed.
Prior to the 2016 survey (2013 and earlier), the survey captured the use of 'Pain-killers/analgesics' and 'Other opiates' separately. In 2016, pain-killers and opioids were combined into one section (now called 'Pain-killers/Pain-relievers and Opioids') and the use of non-opioid over-the-counter (OTC) drugs such as paracetamol and aspirin were removed. This has resulted in a break in the time-series for pain-killers and opiates and also for the overall misuse of pharmaceuticals. While trend data have been reported for these drugs, they are not comparable.
In 2016:
- Just under 1 in 20 (4.8%) Australians had misused a pharmaceutical in the last 12 months (pain-killers/opiates, tranquillisers, steroids, or methadone/buprenorphine) (Table 36).
- The most commonly misused pharmaceuticals were pain-killers/opiates—1 in 10 (9.7%) had misused these drugs in their lifetime making pain-killers/opiates the third most commonly misused illicit drug after cannabis and ecstasy (Table 24).
- In terms of recent use (last 12 months), pain-killers/opiates were the second most commonly used drug after cannabis at 3.6% or approximately 700,000 people.
- About 3 in 4 recent users of pain-killer/opiates reported misusing over-the-counter codeine products such as Nurofen Plus and 4 in 10 reported misusing prescription codeine products such as Panadeine Forte (Figure 14).
Figure 14: Types of pain-killers/opiates misused, recent users of pain-killers/opiates aged 14 and over, 2016 (per cent)
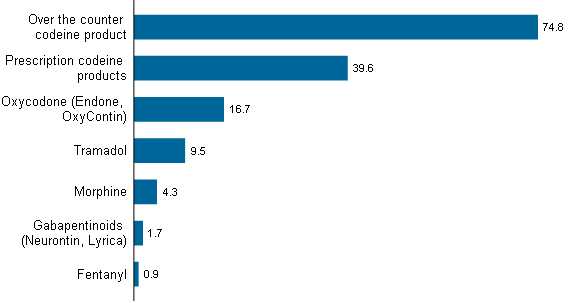
Note: Base is recent users of pain-killers and opiates.
Source: NDSHS 2016 preliminary findings (Data tables).
Emerging psychoactive substances
The 2013 NDSHS was the first to collect data on use of emerging psychoactive substances (EPS). EPS is a term used to describe drugs that are relatively new to the recreational drug market and have mind-altering effects similar to conventional illicit drugs (including those known as meow meow, DMT, Kronic and BZP) (NDARC 2013).
Most people are no longer using synthetic cannabinoids
- Although lifetime use of synthetic cannabinoids doubled from 2013 to 2016 (from 1.3% to 2.8%), recent use dropped by three quarters (declined from 1.2% in 2013 to 0.3%), and all age groups reported significant declines in recent use (Table 38). This indicates that while people may have experimented with this drug since 2013, most choose to no longer to use them in 2016.
- Other psychoactive substances such as Mephedrone and DMT were used by 0.3% of the population in 2016 (about 60,000 people) a slight but not significant decline from 0.4% in 2013 (Table 38).
Harms
In 2016, 9.2% of the population (about 1.8 million) had been a victim of an illicit-drug related incident in the previous 12 months, a significant increase from 8.2% in 2013 (Table 39). There was a slight but non-significant decline in the proportion of people reporting that they were physically abused, from 2.1% in 2013 to 1.8% in 2016, but the proportion being put in fear significantly increased (from 5.0% to 6.0%)
Attitudes and perceptions
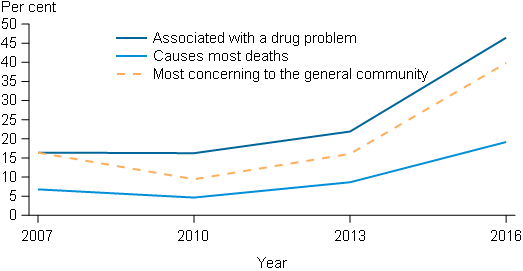
There was a clear change in people’s attitudes towards specific drugs, particularly meth/amphetamines (Figure 15), in 2016.
- Meth/amphetamine was the drug most likely to be associated with a 'drug problem' and perceived to be of most concern for the general community. The proportion nominating meth/amphetamines more than doubled for both these perceptions from 2013 to 2016 (Tables 40 and 42). It was also the first time that more people thought that meth/amphetamines was of more of a concern to the general community than alcohol.
- The proportion nominating meth/amphetamine as the drug that caused the most deaths also doubled and it was the third highest drug mentioned, after alcohol and tobacco (Table 41).
- A range of factors such as media coverage and personal experience are likely to influence opinions on this issue.
- Due to the large increase in the proportion nominating meth/amphetamines, a number of drugs were significantly less likely to be thought of when thinking about a drug problem, including cannabis (decreasing from 23% in 2007 to 14.6% in 2016), heroin (26% to 14.0%) and cocaine (11.0% to 8.1%).
Figure 15: Perceptions of meth/amphetamines, people aged 14 years of older, 2007 to 2016 (per cent)
Source: NDSHS 2016 preliminary findings (Data tables).